Reinvest or Spend? What Turning On DRIP Does to Your Portfolio Over 20 Years
Dividend reinvestment is the quiet engine behind most long-term dividend success stories. Set your own yield, growth and timeline and watch the gap open up.
The short version
- DRIP means your dividends automatically buy more shares instead of landing as cash.
- More shares means bigger future dividends, which buy even more shares. That loop is compounding.
- The longer your timeline, the bigger the gap between reinvesting and spending.
Every dividend investor hits the same fork in the road. The payout lands in your account. Do you spend it, or put it back to work? Most brokerages let you flip a switch called DRIP, short for dividend reinvestment plan, and make that decision once. It might be the most important switch in your account.
How the loop works
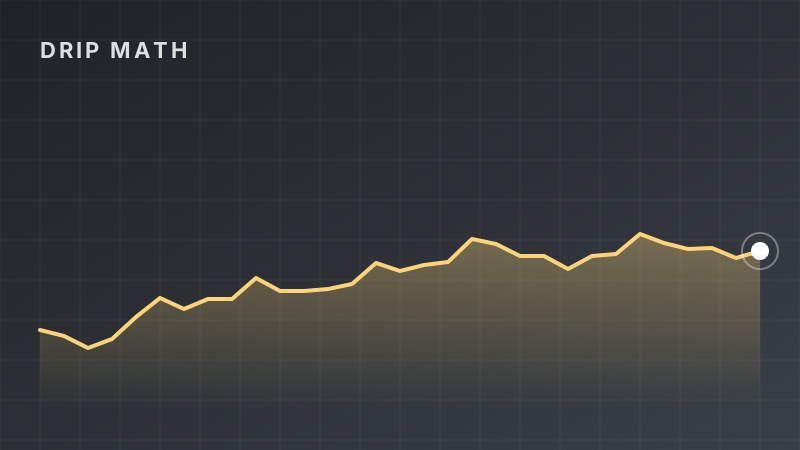
Say you own $100,000 of SCHD, which yields 3.0% today. That is about $3,000 a year. With DRIP on, that money buys more SCHD shares. Next year you own more shares, so your dividend is bigger, so you buy even more shares. Stack that on top of any growth in the share price, and the curve bends upward.
Spend the dividends instead, and your share count never changes. Your income can still grow if the fund raises its payout, but you lose the compounding on the reinvested dollars.
DRIP vs. taking the cash
Same investment, same yield, same growth. The only difference is what happens to the dividends.
Illustration only. Assumes a steady yield and price growth, monthly compounding and no taxes. "Cash route" adds up the dividends you took without investing them.
What to try in the calculator
- Stretch the timeline. Move years from 10 to 30. The gap between the two lines grows much faster than the timeline does.
- Raise the yield, drop the growth. This mimics a high-yield option fund. Notice that if price growth goes negative, reinvesting buys more shares of a shrinking asset. That is why total return matters, not just yield.
- Add monthly contributions. Regular buying plus DRIP is the classic recipe behind most "I built a six-figure dividend portfolio" stories.
When spending makes more sense
DRIP is a growth tool. Once you actually need the income, flipping it off is the whole point of building the portfolio. Many investors run DRIP for decades and switch to cash in retirement. Others reinvest from one fund into another, for example taking payouts from a high-yield fund like JEPI, which yields 7.5%, and buying a dividend grower like DGRO with them.
For a year-by-year projection using live yields from our database, try DividendProjection.com. More calculators live on our Tools page and at TopDividendTools.com.
How this article was made: Benjie picks every topic based on what he finds useful as a dividend investor and what readers ask about. Parts of this article were drafted with help from AI tools, then edited, fact-checked and shaped by Benjie. All fund numbers come from the TopETFs database and update daily.
Disclaimer: TopETFs.com is published by Dividend Empire LLC for educational and entertainment purposes only. We are not financial advisors, and nothing on this site is financial advice, a recommendation, or a solicitation to buy or sell any security. ETF data is compiled from public sources and fund issuers, may be delayed, inaccurate or outdated, and may differ from the fund sponsor's own figures. Yields are trailing distribution yields, are not guaranteed, and distributions may include return of capital, which reduces your cost basis and is not a measure of performance. Total returns are since each fund's inception unless noted and are not comparable across funds with different start dates. Past performance does not guarantee future results. Investing carries risk, including loss of principal. Read each fund's prospectus and consult a licensed financial advisor before investing. Dividend Empire LLC receives compensation from ETF issuers for sponsored placements, which are labeled as such.