The Yield Trap: Why the Biggest Payout Isn't Always the Best Return
We plotted every income ETF we track by yield and total return. The chart shows why chasing the highest yield can quietly cost you money, and how to read a fund in ten seconds.
The short version
- Yield tells you what a fund pays. Total return tells you what you actually made, payouts plus price change.
- Many of the highest-yield ETFs have lower share prices than when they launched. We flag that as price decay.
- A balanced read uses three numbers: yield, total return, and whether the price has held up.
Picture two funds. One pays 5% a year and its share price climbs 5% a year. The other pays 25% a year and its share price falls 22% a year. The second one looks five times better on a yield screen. It has made you less than a third as much money.
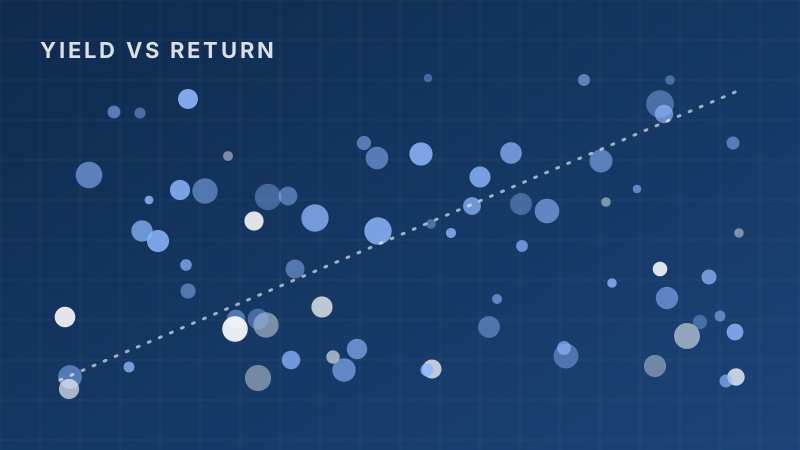
That gap between what a fund pays and what it earns is the most expensive blind spot in income investing. So we plotted all 167 income ETFs in our database to see where each one actually lands.
Yield vs. total return for every income ETF we track
Each dot is one fund. 0 funds shown. Orange dots have price decay.
Total return is since each fund's inception, so older funds have had more time to compound. Use the slider to add the ultra-high-yield funds. Hover any dot for details, click to open it.
How to read the chart
Funds in the upper left pay modest yields but have grown a lot. That is where the classic dividend funds live. SCHD yields 3.0% with a total return of +539% since it launched. DIVO, which adds a light covered call overlay to dividend stocks, yields 4.8% with +217%.
As you slide the yield filter to the right, the dots start sinking and turning orange. Those are funds where the payout has been bigger than what the strategy could earn, so part of it came out of the share price. Slide it all the way up and you will find single-stock option funds like MSTY, yielding 100%, and newer funds like ULTI at 67.0% with a total return of -48%.
What "price decay" means here
On our sites, price decay is a simple flag: is the fund's share price below where it started? It is not a grade and it is not a sell signal. Plenty of investors knowingly hold decaying funds because they want the cash flow and are spending it.
But you should know which kind of fund you own. If you are reinvesting the distributions to grow your income, a fund that shrinks its own share price is working against you. If you are spending every payout, what matters is whether the income stream holds up.
The ten-second check
Before you buy any income ETF, pull up three numbers. You can get all three on its profile page or the Income hub.
- Yield. What it pays today. Ask whether that level is realistic for the strategy.
- Total return. What an investor who reinvested every payout actually earned.
- Price decay. Whether the share price has held up since launch.
If the yield is huge, total return is weak and the price has decayed, you are looking at a fund that pays you with your own principal. That can still fit a specific plan, but it should never be a surprise.
Total return leaders among large income ETFs
Income ETFs with more than $5B in assets, total return since inception
Longer track records compound more, so compare funds with similar start dates when you can. Past performance does not guarantee future results.
The takeaway
High yield is not bad. It is a tool, and like any tool it has a cost. Our job is to show you the cost next to the payout, every time. When you find a fund that pays well, has a healthy total return and has kept its share price intact, that is the rare combination worth a closer look.
If you want to go deeper on why option funds pay what they do, start with Covered Call ETFs, Explained.
How this article was made: Benjie picks every topic based on what he finds useful as a dividend investor and what readers ask about. Parts of this article were drafted with help from AI tools, then edited, fact-checked and shaped by Benjie. All fund numbers come from the TopETFs database and update daily.
Disclaimer: TopETFs.com is published by Dividend Empire LLC for educational and entertainment purposes only. We are not financial advisors, and nothing on this site is financial advice, a recommendation, or a solicitation to buy or sell any security. ETF data is compiled from public sources and fund issuers, may be delayed, inaccurate or outdated, and may differ from the fund sponsor's own figures. Yields are trailing distribution yields, are not guaranteed, and distributions may include return of capital, which reduces your cost basis and is not a measure of performance. Total returns are since each fund's inception unless noted and are not comparable across funds with different start dates. Past performance does not guarantee future results. Investing carries risk, including loss of principal. Read each fund's prospectus and consult a licensed financial advisor before investing. Dividend Empire LLC receives compensation from ETF issuers for sponsored placements, which are labeled as such.