MSTY ETF: Dividend Yield, Total Return and What $10,000 Pays Today
MSTY ETF pays weekly using MicroStrategy options. See the live yield, fee, total return, price decay flag and what $10,000 pays per week and per year.
The short version
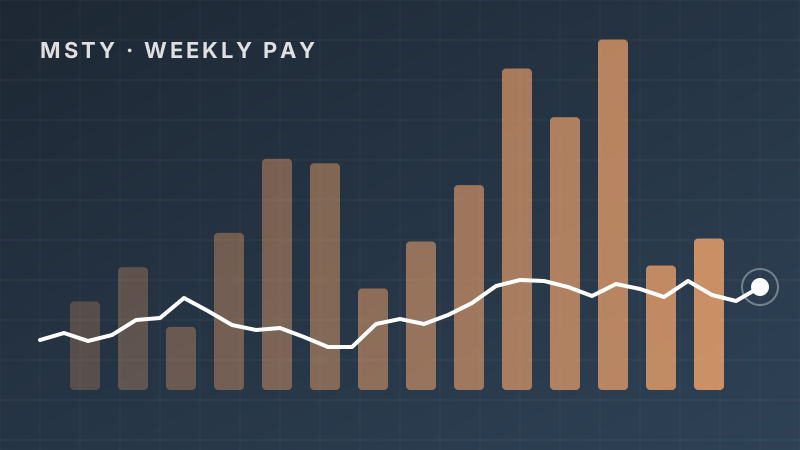
- MSTY yields 76.0% today and pays Weekly. On $10,000 that is roughly $146 per week at the current rate, but the payout changes.
- Total return since inception is 78.0%, yet our price decay flag reads Yes. The yield is big, and so is the cost to the share price.
- It is a single-stock options income fund tied to MicroStrategy. That makes it one of the riskiest ways to collect weekly income.
The MSTY ETF is a YieldMax fund that tries to turn the wild price swings of MicroStrategy (MSTR) into weekly cash. Right now it shows a 76.0% yield, a 0.99% expense ratio and $1.1B in assets. A $10,000 position would throw off about $7,600 a year at today's rate, if nothing changes. Spoiler: something always changes.
MSTY vs other weekly payers
What MSTY is and who runs it
MSTY is the YieldMax MSTR Option Income Strategy ETF. YieldMax is the brand behind a whole family of single-stock option income funds. MSTY started trading on 2/22/2024, so it is a young fund with a short track record.
The stock behind it is MicroStrategy, a software company that is now better known for holding a very large amount of bitcoin on its balance sheet. Because of that, MSTR tends to move hard when bitcoin moves, and often harder. That volatility is the raw material MSTY uses to pay you.
One thing to know up front: MSTY is not a fund that owns a basket of companies. It is a bet on one stock and the options market around it.
How the weekly payout is produced
MSTY does not simply buy MSTR shares and sell covered calls the way a plain covered call fund would. It uses what is called a synthetic covered call. In plain English, the fund uses options to copy the ups and downs of MSTR, then sells call options against that position and collects the premium (the cash buyers pay for those options).
The rest of the fund is typically parked in short-term Treasuries and cash as collateral. The option premium, plus that interest, is where the distributions come from. When MSTR is wildly volatile, option premiums are fat, and that is why the yield can look so huge.
Selling calls has a trade-off. You get paid now, but you give up a chunk of the upside if MSTR rips higher. You still carry most of the downside if it falls. If you want a deeper walkthrough of that mechanism, read my guide on where covered call yields actually come from.
The income math: weekly, monthly and yearly
Here is what the current 76.0% yield means in dollars. These are estimates at today's rate, not promises.
- $10,000 invested: about $146 per week, $633 per month and $7,600 per year.
- $100,000 invested: about $1,462 per week, $6,333 per month and $76,000 per year.
- Target of $1,000 a month: you would need about $15,789 invested at this yield.
Those numbers look amazing. But the payout is not a fixed coupon. It moves with option premiums, which move with MSTR volatility. A calm stretch means smaller checks. A wild stretch means bigger ones. Weekly pay does not mean steady pay.
Also remember the yield is built from recent distributions and then annualized. It is a snapshot of the past, not a forecast. If you want to see how a bigger weekly stream stacks up across the category, I broke it down in what $10,000 earns in weekly-pay ETFs.
Total return since inception and price decay
This is the part that matters most. Total return since inception for MSTY is 78.0%. That figure counts the distributions you received plus the change in share price. And our database flags price decay as Yes.
Price decay means the share price (NAV, or net asset value, the per-share value of the fund's holdings) has drifted down over time. Part of that is the strategy: you sell away the upside, so the fund cannot fully recover after a drop. Part of it is that some of the distribution can be return of capital, which is the fund handing you back some of your own money rather than pure profit. Return of capital is not automatically bad, but it does mean the yield overstates what the fund actually earned.
Here is how I read it. A positive total return since inception says the payouts have more than offset the price drop so far. It does not say that will keep happening. Also, MSTY launched on 2/22/2024, and total return is measured from each fund's own start date. Comparing it to funds that launched earlier or later is not apples to apples.
For a full explanation of why the biggest payout is not always the best result, see the yield trap article.
The costs: fees and size
MSTY charges a 0.99% expense ratio. That is the yearly fee taken from fund assets. On $10,000 that works out to about $99 a year, taken out of the fund before you see anything. It is on the high side for an ETF, though normal for this style of single-stock option fund.
With $1.1B in assets, MSTY is one of the bigger funds in the weekly pay world. That helps with trading liquidity. It does not make the strategy safer. If you want to see what fees do over time, my expense ratio math piece shows it visually.
The main risks
- Single-stock concentration. Everything rides on MSTR. There is no diversification inside the fund.
- Bitcoin sensitivity. MSTR often moves with bitcoin, so a crypto selloff can hit this fund hard.
- Capped upside, open downside. You give up big rallies but still take most of the losses.
- Variable income. Weekly distributions can shrink fast if volatility drops or the share price falls.
- NAV erosion. If you spend every dollar you receive, the share count stays the same but each share can be worth less.
- Tax and classification. Distributions can be taxed in different ways, including return of capital. Check the fund's own notices and talk to a tax pro.
How MSTY compares to close alternatives
Let me put MSTY next to a few funds that do something similar. Remember that every one of these started on a different date.
MSTY vs CONY
CONY is the YieldMax COIN fund, built on Coinbase. It is another crypto-linked single-stock income fund. CONY yields 58.0% with a total return since inception of 43.0%, versus 76.0% and 78.0% for MSTY. Both carry the price decay flag: CONY shows Yes and MSTY shows Yes.
MSTY vs ULTY
ULTY spreads its option income across several high-volatility stocks instead of one. It yields 61.0% with a 1.40% fee and a total return since inception of 12.0%. You get more variety than MSTY, but you pay a higher fee.
MSTY vs CHPY
CHPY is a semiconductor-focused weekly payer. It yields 43.0%, and our price decay flag shows No. It is far newer (it started 4/2/2025), so the track record is short, but it is a lower-yield, more diversified option if you want weekly checks without a single-stock bet. I covered its payouts in every CHPY dividend ever paid.
For other names in the category, TSLY yields 50.0% and NVDY yields 30.0%. You can screen the whole list at WeeklyETFs.com, or dig into every income fund at TopDividendETFsPRO.
What your money earns in MSTY and similar weekly payers
Estimated annual income at each fund's current yield
Today's income only. Yields change and are not guaranteed.
Who MSTY tends to fit, and who should skip it
MSTY tends to fit investors who already understand MSTR and bitcoin risk, can handle large swings, and treat the fund as a small, high-risk income slice rather than a core holding. Some of those investors reinvest the payouts to rebuild shares, which I looked at in reinvest or spend.
It tends to be a poor fit for retirees who need dependable income, anyone who cannot stomach a large drop in share price, and beginners looking for a simple dividend fund. If you are counting on that weekly check to pay a bill, a fund whose payout floats with a volatile stock is a shaky foundation.
One more point. If you plan to hold it, size it small enough that a bad year will not change your life.
FAQ
Does MSTY pay weekly?
Yes. Our data shows MSTY pays Weekly. The amount is not fixed and changes with option premiums.
What is the MSTY dividend yield?
The current yield is 76.0%. It is based on recent payouts and can move up or down quickly.
Is MSTY a good investment?
That depends on your risk tolerance. It has a total return since inception of 78.0%, but the price decay flag is Yes and the fund is tied to a single volatile stock.
What does MSTY hold?
It does not mainly hold MSTR shares. It uses options to get MSTR exposure and sells call options for income, with Treasuries and cash as collateral.
How much does $10,000 in MSTY pay?
At today's yield, about $146 per week or $7,600 per year. Future payouts may be very different.
MSTY vs CONY: which is better?
They are different bets. MSTY follows MicroStrategy and CONY follows Coinbase. Compare yield, fees and price decay above, and remember they started on different dates.
Benjie's bottom line
MSTY is a powerful income machine with a very sharp edge. A 76.0% yield and weekly pay are eye-catching, and a total return since inception of 78.0% shows the payouts have counted for something. But the price decay flag, the single-stock risk and the 0.99% fee are the other half of the story.
This isn't a buy or sell signal. If you look at MSTY, look at total return first, size it small, and do your own due diligence. For more weekly payers to compare, head to WeeklyETFs.com.
ETFs in this story
How this article was made: Benjie picks every topic based on what he finds useful as a dividend investor and what readers ask about. Parts of this article were drafted with help from AI tools, then edited, fact-checked and shaped by Benjie. All fund numbers come from the TopETFs database and update daily.
Disclaimer: TopETFs.com is published by Dividend Empire LLC for educational and entertainment purposes only. We are not financial advisors, and nothing on this site is financial advice, a recommendation, or a solicitation to buy or sell any security. ETF data is compiled from public sources and fund issuers, may be delayed, inaccurate or outdated, and may differ from the fund sponsor's own figures. Yields are trailing distribution yields, are not guaranteed, and distributions may include return of capital, which reduces your cost basis and is not a measure of performance. Total returns are since each fund's inception unless noted and are not comparable across funds with different start dates. Past performance does not guarantee future results. Investing carries risk, including loss of principal. Read each fund's prospectus and consult a licensed financial advisor before investing. Dividend Empire LLC receives compensation from ETF issuers for sponsored placements, which are labeled as such.