Every CHPY Dividend Ever Paid: Full Weekly Payout History, Calculator and What It Means
Every CHPY dividend since its April 2025 launch: all 78 weekly payouts, totals by month and year, return of capital estimates, plus a CHPY income calculator built on its real payout history.
The short version
- $CHPY has made 78 weekly payouts since its first distribution in April 2025, totaling $38.02 per share through the payout going out on October 8, 2026.
- Payouts have trended up: the average weekly check was $0.4126 in 2025 and $0.5586 so far in 2026. The last 52 payouts add up to $27.66 per share.
- Most of those payouts were estimated as return of capital. That is a tax label, not a scorecard, but it is worth understanding before you buy. Use the calculators below to see what CHPY has actually paid on your share count.
Every single week, $CHPY, the YieldMax Semiconductor Portfolio Option Income ETF, pays a dividend. Since it launched on April 2, 2025, it has paid 78 distributions worth a combined $38.02 per share, ranging from a low of $0.3454 to a high of $0.7754. Below is every one of those payouts, the totals by month and year, and a set of calculators that run on the fund's real payout history instead of a single yield number.
What CHPY is
CHPY is an actively managed ETF from YieldMax that holds a basket of roughly 15 to 30 semiconductor stocks and sells options on them to generate weekly income. Unlike the single-stock YieldMax funds such as NVDY or AMDY, it owns the chip stocks directly and spreads the bet across the whole sector.
Here are the basics from YieldMax's fund page, as of early October 2026:
| Detail | CHPY |
|---|---|
| Full name | YieldMax Semiconductor Portfolio Option Income ETF |
| Issuer | YieldMax (advised by Tidal Investments) |
| Inception date | April 2, 2025 |
| Exchange | NYSE Arca |
| Payout schedule | Weekly |
| Expense ratio | 1.03% |
| Net assets | About $1.34 billion (Oct 5, 2026) |
| NAV | $71.45 (Oct 5, 2026) |
| Distribution rate | 42.55% (Oct 6, 2026, based on the latest weekly payout annualized) |
| 30-day SEC yield | -0.38% (Sep 30, 2026) |
| Holdings | About 15 to 30 semiconductor companies |
The biggest positions recently were NVIDIA, AMD, Marvell, Lam Research, Intel, Micron, Broadcom, ASE Technology, United Microelectronics and Astera Labs, each sitting somewhere around 4% to 6% of the fund. So no single chip stock makes or breaks it.
Two numbers in that table look strange side by side: a distribution rate above 40% and a negative SEC yield. The SEC yield only counts dividends and interest from the stocks, minus fees, and chip stocks pay very little in dividends. Almost all of CHPY's payout comes from option premium, which the SEC yield leaves out. That is normal for this style of fund.
How CHPY makes its weekly income
YieldMax describes the strategy as selling call spreads on the stocks in the portfolio. In plain English, the fund sells call options to collect premium, and also buys further-out calls so that some upside is left on the table if the stocks rip higher. It is a cousin of the classic covered call, which I break down in Covered Call ETFs, Explained.
Semiconductor stocks are volatile, and volatile stocks pay fatter option premiums. That is the engine behind CHPY's big payouts. The trade-off is the same one every option-income fund makes: you collect income every week, you give up part of the upside in big rallies, and you still own the full downside if chip stocks fall.
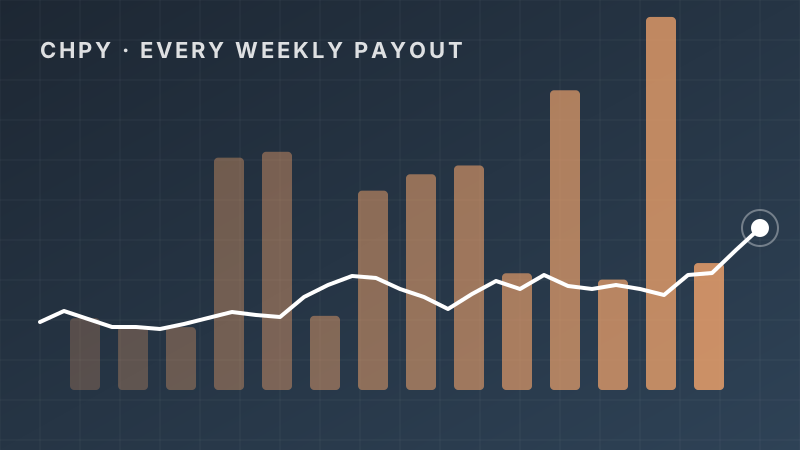
Every CHPY dividend, charted
Each bar is one weekly payout, by ex-dividend date. Hover or tap a bar to see the exact amount. The dashed line is the 4-week moving average, which smooths out the week-to-week noise.
CHPY weekly distributions since launch
Dollars per share, by ex-dividend date
Source: YieldMax fund page distribution history. Updated through the payout declared October 6, 2026.
The full CHPY dividend history table
Here is every payout since inception, newest first. ROC is YieldMax's estimate of how much of each payout was return of capital. The table scrolls, and you can filter it by year.
Every CHPY distribution since inception
78 payouts, $38.02 per share in total
| # | Ex-date | Pay date | Amount | Est. ROC |
|---|---|---|---|---|
| 78 | Oct 7, 2026 | Oct 8, 2026 | $0.5847 | 100% |
| 77 | Sep 30, 2026 | Oct 1, 2026 | $0.5385 | 99.9% |
| 76 | Sep 23, 2026 | Sep 24, 2026 | $0.5256 | 99.7% |
| 75 | Sep 16, 2026 | Sep 17, 2026 | $0.7373 | 100% |
| 74 | Sep 9, 2026 | Sep 10, 2026 | $0.5165 | 0% |
| 73 | Sep 2, 2026 | Sep 3, 2026 | $0.5132 | 84.4% |
| 72 | Aug 26, 2026 | Aug 27, 2026 | $0.5177 | 0% |
| 71 | Aug 19, 2026 | Aug 20, 2026 | $0.5702 | 100% |
| 70 | Aug 12, 2026 | Aug 13, 2026 | $0.5472 | 97.7% |
| 69 | Aug 5, 2026 | Aug 6, 2026 | $0.5292 | 0% |
| 68 | Jul 29, 2026 | Jul 30, 2026 | $0.5428 | 97.0% |
| 67 | Jul 22, 2026 | Jul 23, 2026 | $0.5470 | 0% |
| 66 | Jul 15, 2026 | Jul 16, 2026 | $0.5925 | 0% |
| 65 | Jul 8, 2026 | Jul 9, 2026 | $0.6274 | 59.6% |
| 64 | Jul 1, 2026 | Jul 2, 2026 | $0.6672 | 0% |
| 63 | Jun 24, 2026 | Jun 25, 2026 | $0.7754 | 0% |
| 62 | Jun 17, 2026 | Jun 18, 2026 | $0.7558 | 0% |
| 61 | Jun 10, 2026 | Jun 11, 2026 | $0.6204 | 24.2% |
| 60 | Jun 3, 2026 | Jun 4, 2026 | $0.7119 | 100% |
| 59 | May 27, 2026 | May 28, 2026 | $0.6684 | 100% |
| 58 | May 20, 2026 | May 21, 2026 | $0.6444 | 100% |
| 57 | May 13, 2026 | May 14, 2026 | $0.6629 | 100% |
| 56 | May 6, 2026 | May 7, 2026 | $0.6024 | 100% |
| 55 | Apr 29, 2026 | Apr 30, 2026 | $0.6041 | 100% |
| 54 | Apr 22, 2026 | Apr 23, 2026 | $0.5008 | 100% |
| 53 | Apr 15, 2026 | Apr 16, 2026 | $0.5384 | 66.8% |
| 52 | Apr 8, 2026 | Apr 9, 2026 | $0.4406 | 65.6% |
| 51 | Apr 1, 2026 | Apr 2, 2026 | $0.4089 | 50.7% |
| 50 | Mar 25, 2026 | Mar 26, 2026 | $0.4912 | 0% |
| 49 | Mar 18, 2026 | Mar 19, 2026 | $0.3851 | 0% |
| 48 | Mar 11, 2026 | Mar 12, 2026 | $0.4384 | 0% |
| 47 | Mar 4, 2026 | Mar 5, 2026 | $0.4577 | 89.7% |
| 46 | Feb 25, 2026 | Feb 26, 2026 | $0.4686 | 100% |
| 45 | Feb 18, 2026 | Feb 19, 2026 | $0.5259 | 100% |
| 44 | Feb 11, 2026 | Feb 12, 2026 | $0.5293 | 34.5% |
| 43 | Feb 4, 2026 | Feb 5, 2026 | $0.5253 | 0% |
| 42 | Jan 28, 2026 | Jan 29, 2026 | $0.4826 | 100% |
| 41 | Jan 21, 2026 | Jan 22, 2026 | $0.5267 | 100% |
| 40 | Jan 14, 2026 | Jan 15, 2026 | $0.5196 | 100% |
| 39 | Jan 7, 2026 | Jan 8, 2026 | $0.5040 | 86.9% |
| 38 | Dec 31, 2025 | Jan 2, 2026 | $0.4401 | 99.5% |
| 37 | Dec 24, 2025 | Dec 26, 2025 | $0.4403 | 11.6% |
| 36 | Dec 17, 2025 | Dec 18, 2025 | $0.3786 | 97.1% |
| 35 | Dec 10, 2025 | Dec 11, 2025 | $0.3984 | 98.1% |
| 34 | Dec 3, 2025 | Dec 4, 2025 | $0.4347 | 99.4% |
| 33 | Nov 26, 2025 | Nov 28, 2025 | $0.4394 | 20.0% |
| 32 | Nov 19, 2025 | Nov 20, 2025 | $0.4175 | 0% |
| 31 | Nov 12, 2025 | Nov 13, 2025 | $0.4544 | 100% |
| 30 | Nov 5, 2025 | Nov 6, 2025 | $0.4595 | 0% |
| 29 | Oct 29, 2025 | Oct 30, 2025 | $0.4634 | 59.1% |
| 28 | Oct 22, 2025 | Oct 23, 2025 | $0.5788 | 67.8% |
| 27 | Oct 15, 2025 | Oct 16, 2025 | $0.4066 | 100% |
| 26 | Oct 9, 2025 | Oct 10, 2025 | $0.4307 | 100% |
| 25 | Oct 2, 2025 | Oct 3, 2025 | $0.4093 | 40.9% |
| 24 | Sep 25, 2025 | Sep 26, 2025 | $0.4125 | 95.5% |
| 23 | Sep 18, 2025 | Sep 19, 2025 | $0.4204 | 100% |
| 22 | Sep 11, 2025 | Sep 12, 2025 | $0.3838 | 38.5% |
| 21 | Sep 4, 2025 | Sep 5, 2025 | $0.3825 | 100% |
| 20 | Aug 28, 2025 | Aug 29, 2025 | $0.3964 | 97.4% |
| 19 | Aug 21, 2025 | Aug 22, 2025 | $0.3993 | 100% |
| 18 | Aug 14, 2025 | Aug 15, 2025 | $0.4056 | 20.0% |
| 17 | Aug 7, 2025 | Aug 8, 2025 | $0.3893 | 84.2% |
| 16 | Jul 31, 2025 | Aug 1, 2025 | $0.4151 | 99.5% |
| 15 | Jul 24, 2025 | Jul 25, 2025 | $0.3723 | 100% |
| 14 | Jul 17, 2025 | Jul 18, 2025 | $0.3730 | 100% |
| 13 | Jul 10, 2025 | Jul 11, 2025 | $0.3488 | 100% |
| 12 | Jul 3, 2025 | Jul 7, 2025 | $0.4223 | 99.1% |
| 11 | Jun 26, 2025 | Jun 27, 2025 | $0.3767 | 96.8% |
| 10 | Jun 20, 2025 | Jun 23, 2025 | $0.4056 | 100% |
| 9 | Jun 12, 2025 | Jun 13, 2025 | $0.4031 | 100% |
| 8 | Jun 5, 2025 | Jun 6, 2025 | $0.3455 | 100% |
| 7 | May 29, 2025 | May 30, 2025 | $0.3860 | 96.9% |
| 6 | May 22, 2025 | May 23, 2025 | $0.3991 | 100% |
| 5 | May 15, 2025 | May 16, 2025 | $0.3820 | 100% |
| 4 | May 8, 2025 | May 9, 2025 | $0.3767 | 97.9% |
| 3 | May 1, 2025 | May 2, 2025 | $0.6229 | 87.7% |
| 2 | Apr 24, 2025 | Apr 25, 2025 | $0.3454 | 0.2% |
| 1 | Apr 17, 2025 | Apr 21, 2025 | $0.3627 | n/a |
ROC figures are YieldMax's estimates at the time of each payout and can change. The final tax breakdown comes on your 1099. See the 19a-1 notices on YieldMax's site for details.
CHPY dividends by year and by month
Because CHPY pays weekly, some months get five payouts and some get four. That alone can swing a monthly total by 20% or more, so don't read too much into one month's number.
| Year | Payouts | Total per share | Average payout |
|---|---|---|---|
| 2025 (from April 17) | 38 | $15.68 | $0.4126 |
| 2026 (through Oct 7) | 40 | $22.35 | $0.5586 |
| Since inception | 78 | $38.02 | $0.4875 |
CHPY payouts by month
Per share, grouped by ex-dividend month
| Month | Payouts | Total per share |
|---|---|---|
| October 2026 | 1 | $0.5847 |
| September 2026 | 5 | $2.8311 |
| August 2026 | 4 | $2.1643 |
| July 2026 | 5 | $2.9769 |
| June 2026 | 4 | $2.8635 |
| May 2026 | 4 | $2.5781 |
| April 2026 | 5 | $2.4928 |
| March 2026 | 4 | $1.7724 |
| February 2026 | 4 | $2.0491 |
| January 2026 | 4 | $2.0329 |
| December 2025 | 5 | $2.0921 |
| November 2025 | 4 | $1.7708 |
| October 2025 | 5 | $2.2888 |
| September 2025 | 4 | $1.5992 |
| August 2025 | 4 | $1.5906 |
| July 2025 | 5 | $1.9315 |
| June 2025 | 4 | $1.5309 |
| May 2025 | 5 | $2.1667 |
| April 2025 | 2 | $0.7081 |
A few things stand out to me in the history:
- The payouts grew. The first 13 payouts averaged $0.3982. The most recent 13 averaged $0.5586. A rising share price helps here, since the same percentage of option premium on a bigger NAV is a bigger dollar check.
- The biggest weeks clustered in June 2026. The record was $0.7754 (ex-date June 24, 2026), followed closely by $0.7558 the week before.
- The smallest payout was $0.3454 (ex-date April 24, 2025), back in the fund's first month.
- Only one payout ever came in above $0.70 outside of June 2026: the $0.7373 payout in mid September 2026. Big weeks happen, but they are not the norm.
Track CHPY next to 160+ other income ETFs with live yields, total returns, price decay flags and advanced filters, all in one terminal.
CHPY income calculator, built on real payouts
Most dividend calculators take one yield and multiply. That is risky with a fund like CHPY, because the weekly check moves around. This one lets you pick which slice of CHPY's actual history to base the estimate on, from the latest payout to the all-time low.
What would CHPY pay you?
Based on CHPY's real weekly payout history
Monthly figure is the yearly total divided by 12. Past payouts are not a promise of future ones.
Try flipping between "latest payout" and "lowest payout ever." The gap between those two numbers is the range you should plan around, not the single best-case figure.
What if you had bought CHPY earlier?
Pick a starting payout and a share count, and this adds up every dividend CHPY actually paid from that week through the latest one. It does not include reinvesting or changes in the share price, just the cash that would have landed in your account.
CHPY dividends collected since a start date
Real payouts, no reinvestment
Assumes you owned the shares before each ex-date and held through the latest payout. Taxes not included.
How much CHPY do you need for a monthly income goal?
Flip the math around. Type in the monthly income you want and see how many shares, and roughly how many dollars, it would take based on CHPY's own payout history.
CHPY income goal calculator
Shares needed at each slice of payout history
| Based on | Weekly payout | Shares needed | Approx. cost |
|---|
Shares needed = monthly goal times 12, divided by (weekly payout times 52). Plan with a cushion, payouts move every week.
If you want a longer projection with reinvestment, the DRIP calculator and the CHPY dividend calculator run on the live yield from our database. For a bigger picture, the income goal calculator works for any fund we track, and DividendProjection.com projects a whole portfolio.
About all that return of capital
Look at the ROC column in the table and you will see a lot of 100% estimates. Across the payouts where YieldMax published an estimate, the average came out around 70% return of capital, and 32 payouts were estimated at roughly 100%.
Return of capital (ROC) is a tax classification. It means that payout is not taxed as income in the year you get it. Instead, it lowers your cost basis, and you settle up when you sell. For option-income funds, a high ROC estimate can come from how option gains and losses are timed for tax purposes, and it does not automatically mean the fund is handing your own money back.
The real test is whether the share price holds up while the payouts flow. That is what total return measures. Our database shows CHPY's total return since inception at 188%, and its price decay flag reads No. YieldMax's own report showed a cumulative NAV return of 156.18% from inception through September 30, 2026. Those strong numbers came during a powerful run for chip stocks, so they say more about the last 18 months than about the next 18. I explain why I always check this in The Yield Trap.
Taxes on funds like this get complicated fast, so talk to a tax professional about your situation. I'm not giving tax advice.
CHPY vs other high-income ETFs
Here is how CHPY stacks up against other YieldMax funds and popular option-income ETFs. Yields and returns update daily from the TopETFs database.
CHPY and the funds people compare it to
A few of these are worth calling out. SOXY is YieldMax's other semiconductor income fund, but it targets a much lower yield of about 12.0% and pays monthly. NVDY and AMDY are single-stock funds, so they ride on one chip company instead of a basket. GPTY is the AI and tech version of CHPY's portfolio approach. And QQQI is a lower-yield, broader Nasdaq option-income fund for comparison.
What your money pays in CHPY vs the alternatives
Estimated annual income at each fund's current yield
Today's income only. Yields change and are not guaranteed.
If weekly income is what you're after, I ranked a whole group of weekly payers in what $10,000 pays in weekly ETFs, and the full live list lives on WeeklyETFs.com and our weekly dividend ETF list. For everything YieldMax runs, see the YieldMax ETF list.
The risks I'd weigh before buying CHPY
- It's one sector. Every holding is a semiconductor company. When chips sell off together, CHPY goes with them, and the weekly income won't fully cover a steep drop.
- Capped upside. Selling call spreads means giving up part of the gains in a strong rally. In a huge chip run, a plain semiconductor fund would likely beat it.
- The payout is not fixed. It depends on option premiums, which depend on volatility. Calm markets can mean smaller checks.
- Short history. CHPY launched in April 2025, during a strong stretch for the sector. It has not been tested through a long chip downturn.
- Cost. The 1.03% expense ratio is high next to a plain index fund. I walk through how much that adds up in the expense ratio math.
If you're deciding whether to spend the weekly checks or put them back to work, reinvest or spend covers that trade-off.
FAQ
How often does CHPY pay dividends?
Every week. CHPY has paid 78 weekly distributions since its first payout in April 2025. The ex-dividend date usually falls midweek, with payment the next business day.
How much has CHPY paid in total since inception?
$38.02 per share across 78 payouts, from the first payout in April 2025 through the payout going out on October 8, 2026.
What is CHPY's latest dividend?
The latest CHPY payout was $0.5847 per share, with an ex-date of October 7, 2026 and a pay date of October 8, 2026.
What is the highest dividend CHPY has paid?
The record is $0.7754 per share, with an ex-date of June 24, 2026. The lowest was $0.3454, with an ex-date of April 24, 2025.
What is CHPY's dividend yield?
Our database shows CHPY's yield at 43.0%. YieldMax listed a distribution rate of 42.55% on October 6, 2026, which annualizes the latest weekly payout. Both numbers move every week.
Is CHPY's dividend return of capital?
Much of it has been estimated as return of capital, averaging around 70% across payouts with an estimate. That is a tax treatment that lowers your cost basis, not necessarily a sign the fund is paying you with your own money. Check total return to see how the fund is really doing.
How much CHPY do I need to make $1,000 a month?
Based on the average of the last 13 payouts ($0.5586 a week), you'd need about 414 shares, roughly $29,580 at a $71.45 share price. Use the goal calculator above to try other assumptions.
What does CHPY invest in?
A portfolio of roughly 15 to 30 semiconductor stocks, such as NVIDIA, AMD, Broadcom, Micron and Marvell, plus call spreads sold on those holdings to generate weekly income.
My bottom line on CHPY's dividends
CHPY has done exactly what it promised so far: a check every single week, 78 in a row, adding up to $38.02 a share. The payouts have grown over time, and the total return since launch has been strong during a great run for chip stocks.
But a weekly payout this big always comes with trade-offs. It's a one-sector fund with capped upside, a short track record, and payouts that move with volatility. I'd plan around the lower end of the history, not the record weeks, and I'd keep an eye on total return, not just the size of the check. This isn't a buy or sell signal. It's the homework I'd want done before putting my own money in.
To compare CHPY with every other income fund on yield, fees, assets and price decay, use TopDividendETFsPRO. For free daily rankings, check TopDividendETFs.com, WeeklyETFs.com and MonthlyETFs.com. New to this style of fund? Start with ETFs 101 and Covered Call ETFs, Explained.
ETFs in this story
How this article was made: Benjie picks every topic based on what he finds useful as a dividend investor and what readers ask about. Parts of this article were drafted with help from AI tools, then edited, fact-checked and shaped by Benjie. All fund numbers come from the TopETFs database and update daily.
Disclaimer: TopETFs.com is published by Dividend Empire LLC for educational and entertainment purposes only. We are not financial advisors, and nothing on this site is financial advice, a recommendation, or a solicitation to buy or sell any security. ETF data is compiled from public sources and fund issuers, may be delayed, inaccurate or outdated, and may differ from the fund sponsor's own figures. Yields are trailing distribution yields, are not guaranteed, and distributions may include return of capital, which reduces your cost basis and is not a measure of performance. Total returns are since each fund's inception unless noted and are not comparable across funds with different start dates. Past performance does not guarantee future results. Investing carries risk, including loss of principal. Read each fund's prospectus and consult a licensed financial advisor before investing. Dividend Empire LLC receives compensation from ETF issuers for sponsored placements, which are labeled as such.