JEPQ ETF: Dividend Yield, Total Return and What $10,000 Pays Today
JEPQ pays monthly income from Nasdaq-100 covered calls. See live yield, fee, total return, price decay and what $10,000 pays, plus who should skip it.
The short version
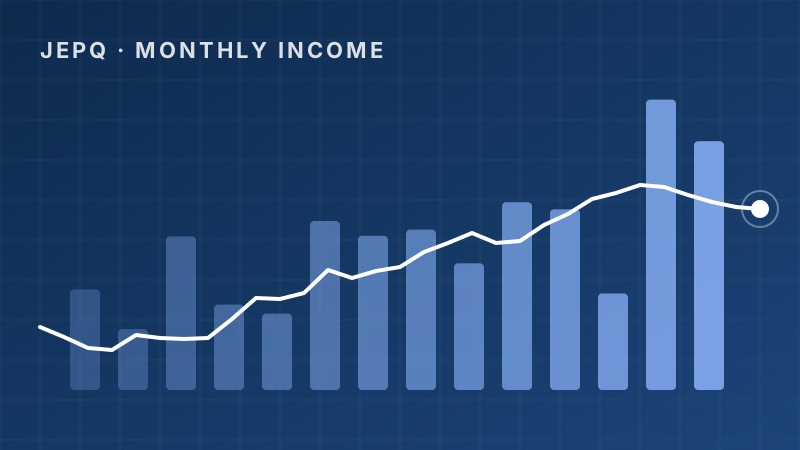
- JEPQ currently yields 11.2% and pays Monthly, which works out to about $1,120 a year on $10,000 at today's yield.
- The income comes from selling call options on the Nasdaq-100, and that caps your upside in strong tech rallies. Since its 5/3/2022 launch, total return is 96.0%.
- It fits investors who want high monthly cash flow with tech exposure. It is a poor fit if you want maximum growth or a stable payout you can count on to the dollar.
JEPQ is a monthly-pay, Nasdaq-100 covered call ETF from JPMorgan. Right now it yields 11.2% with a 0.35% expense ratio, so $10,000 would throw off roughly $93 a month at today's rate. Here is where that money comes from, and what it costs you in upside.
JEPQ vs close alternatives
What JEPQ is and who runs it
JEPQ is the JPMorgan NASDAQ Equity Premium Income ETF. JPMorgan Asset Management runs it, and it is actively managed, so a team picks the holdings instead of copying an index. It launched on 5/3/2022 and has grown to $44.7B in assets. That is a big number for a fund that young.
Think of it as the Nasdaq version of JPMorgan's older income fund, JEPI. Same issuer, same monthly payout idea, but pointed at large tech and growth stocks instead of the broad S&P 500. I cover the two side by side in JEPI vs JEPQ.
How JEPQ makes its money
There are two engines under the hood. First, the fund owns a portfolio of large Nasdaq-100 style stocks, chosen with a rules-based process that tends to lean toward steadier names. Second, it sells call options on the Nasdaq-100 using equity-linked notes (ELNs), which are debt instruments that package the option income for the fund.
A covered call is simple. You collect cash up front (the premium) in exchange for giving up gains above a certain price. If tech stays flat or drifts up slowly, you keep the premium and most of the move. If tech rips higher, your gain is capped. If tech falls, the premium cushions the drop a little, but only a little.
That premium is what funds the monthly distribution. Option premiums are bigger when markets are jumpy, which is why the yield moves around from month to month. If you want the full mechanics, my guide on where covered call yields come from walks through it.
What $10,000 and $100,000 pay
Here is the real-world math at today's 11.2% yield. Treat it as a snapshot, not a promise.
- $10,000 invested: about $1,120 per year, or about $93 per month.
- $100,000 invested: about $11,200 per year, or about $933 per month.
- Target of $1,000 a month: you would need roughly $107,143 invested at the current yield.
Compare that with the safer end of the shelf. The same $100,000 in SGOV, a 0 to 3 month Treasury bill fund, would pay about $333 a month. In SCHD, a quality dividend fund, it would pay about $250 a month. JEPQ pays far more cash today, but it asks you to take stock market risk and give up upside to get it.
The monthly amount is not fixed. JEPQ's distributions rise and fall with option premiums and market conditions, so a bill you plan around should use a conservative estimate. If you want to model it, try the TopETFs calculators or project future income over several years.
Total return and price decay
A big yield means little if the share price erodes. So here is the check I always run. Since inception on 5/3/2022, JEPQ's total return is 96.0%, and our price decay flag reads No. Total return counts both price change and reinvested distributions, which is the number that tells you whether the income was real or just your own capital coming back.
Now the caveat. That period is short, and it began in a stretch where tech did well. JEPQ has not been tested through a long, grinding tech bear market. A clean result on a short record is encouraging, not proof.
Context also matters when you compare it to others. JEPI shows a total return of 95.0%, but it launched on 5/20/2020, so it has had much more time. QQQI is at 65.0% since 1/20/2024, the youngest of the group. VOO shows 844%, but that runs from 9/7/2010, so it is not a fair race against JEPQ. Different start dates mean you cannot read these numbers as a scoreboard.
What you can say is this: income funds like JEPQ tend to give you a smoother ride and more cash, but they usually trail the plain index in big up markets. That is the trade.
How JEPQ compares to close alternatives
JEPQ vs JEPI
JEPI yields 8.0% against JEPQ's 11.2%, and both charge 0.35% and 0.35% respectively. JEPI is built on the S&P 500 and tends to hold more defensive sectors. JEPQ is more tech-heavy, which usually means bigger swings and a bigger payout. See my full JEPI breakdown if you want the other side.
JEPQ vs QQQI
QQQI, from NEOS, also targets the Nasdaq-100 and pays monthly. It yields 14.4% with a 0.68% expense ratio, higher than JEPQ's fee. A higher yield with a higher fee and a much shorter track record is worth looking at carefully. Higher yield usually means giving up more upside or taking more risk somewhere.
JEPQ vs plain index funds and T-bills
VOO yields 1.0% with a 0.03% fee, so you get very little cash but full market upside. SGOV yields 4.0% with almost no price risk. JEPQ sits in the middle: lots of income, real equity risk, capped upside. Many people mix these instead of choosing one.
The main risks
- Capped upside. When the Nasdaq-100 surges, JEPQ will lag it, sometimes by a lot.
- Variable payouts. The monthly check changes. A calm market can mean lower option premiums and a smaller distribution.
- Tech concentration. The fund is tied to the Nasdaq-100, so a sharp drop in big tech hurts it. The premium only cushions part of the fall.
- Short history. It has not lived through a full cycle yet.
- Taxes. Much of the income from this type of strategy is generally taxed as ordinary income rather than qualified dividends, so it can fit better in a tax-advantaged account. Talk to a tax professional about your own situation.
- Active management. You are trusting JPMorgan's process, and the fee is higher than index funds.
Who JEPQ tends to fit, and who should skip it
It tends to fit people who want strong monthly cash flow now and still want some Nasdaq exposure. Retirees topping up income, or anyone building a paycheck from a portfolio, may find it useful as one piece of a mix, not the whole thing.
It tends not to fit younger investors with decades to grow, because the capped upside can cost a lot over time. Growth-focused readers may be better served looking at growth ETFs. It is also a poor match if you need a fixed, predictable payout, or if you are not comfortable with large tech swings.
This is not a buy or sell signal. It is a way to see which side of the trade you are on.
What your money pays in JEPQ and close alternatives
Estimated annual income at each fund's current yield
Today's income only. Yields change and are not guaranteed.
FAQ
Does JEPQ pay monthly?
Yes. JEPQ pays Monthly, but the amount changes from month to month because it depends on option premiums and market conditions.
What is the JEPQ dividend yield?
JEPQ's current yield is 11.2%. That is a trailing snapshot, so it can move up or down as markets and distributions change.
How much do I need in JEPQ to make $1,000 a month?
At today's yield you would need roughly $107,143. For a similar walkthrough on another fund, see how much you need in JEPI.
Does JEPQ have price decay?
Our price decay flag for JEPQ currently reads No, with a total return of 96.0% since inception. The track record is short, so keep watching it.
Is JEPQ better than JEPI?
It depends on what you want. JEPQ is more tech-focused and currently yields 11.2% against JEPI's 8.0%, but it likely swings more. Read JEPI vs JEPQ for the full comparison.
Benjie's bottom line
JEPQ is a clean way to turn Nasdaq-100 exposure into monthly cash, and the numbers so far look solid: a 11.2% yield, a 0.35% fee, and a 96.0% total return since 5/3/2022. But the record is short, the payout moves, and you give up big upside in strong tech years.
Do your own due diligence, and compare it against the full list on TopDividendETFsPRO before you decide how it fits your plan. Nothing here is a recommendation, just the homework I would want done.
ETFs in this story
How this article was made: Benjie picks every topic based on what he finds useful as a dividend investor and what readers ask about. Parts of this article were drafted with help from AI tools, then edited, fact-checked and shaped by Benjie. All fund numbers come from the TopETFs database and update daily.
Disclaimer: TopETFs.com is published by Dividend Empire LLC for educational and entertainment purposes only. We are not financial advisors, and nothing on this site is financial advice, a recommendation, or a solicitation to buy or sell any security. ETF data is compiled from public sources and fund issuers, may be delayed, inaccurate or outdated, and may differ from the fund sponsor's own figures. Yields are trailing distribution yields, are not guaranteed, and distributions may include return of capital, which reduces your cost basis and is not a measure of performance. Total returns are since each fund's inception unless noted and are not comparable across funds with different start dates. Past performance does not guarantee future results. Investing carries risk, including loss of principal. Read each fund's prospectus and consult a licensed financial advisor before investing. Dividend Empire LLC receives compensation from ETF issuers for sponsored placements, which are labeled as such.