VOO ETF Review: Total Return, Fees, Holdings and Who It Fits
A plain-English VOO ETF review: live total return since inception, the tiny fee, top holdings, risks, and how it stacks up against QQQ, VUG and SCHG.
The short version
- VOO has returned 840% in total since its 9/7/2010 inception, with an expense ratio of just 0.03%.
- It holds the S&P 500, so you own the big US names that drive the market, including a heavy tilt to the largest tech companies.
- The yield is only 1.0%. This is a total return fund, not an income fund.
VOO is Vanguard's S&P 500 ETF, and it is one of the simplest ways to own the US large-cap market. Since 9/7/2010 it has delivered 840% in total return, it charges 0.03% a year, and it now manages $1.04T. Here is what it holds, how it has done, and who it fits.
VOO vs close growth alternatives
What VOO is and who runs it
VOO is an exchange-traded fund from Vanguard. It tracks the S&P 500, an index of roughly 500 of the largest US public companies. An ETF is just a basket of stocks you can buy and sell like a single stock. If you want the full mechanics, my guide on how an ETF actually works walks through it.
Vanguard is known for low costs, and the fee shows it. At 0.03% per year, VOO is about as cheap as US equity investing gets. It is also huge, with $1.04T in assets. That size means tight trading spreads and very little worry about the fund closing.
The strategy: own the market, weighted by size
VOO does not try to beat anything. It buys the stocks in the S&P 500 in proportion to their market value, so bigger companies get bigger weights. That is called market-cap weighting. The fund is passive, which means no manager is picking winners, and that is a big reason the fee is so low.
The index covers every major sector, but it does not treat them equally. Technology is the largest sector by a wide margin, followed by areas like financials, health care and consumer names. Because of cap weighting, you get what the market has already rewarded.
Holdings and concentration in the top names
Here is something many people miss. VOO holds about 500 companies, but it is not evenly spread. A handful of mega-cap names (think the large tech and internet leaders like Apple, Microsoft, Nvidia, Amazon and Alphabet) make up a big share of the fund. The exact weights move every day, so check Vanguard's site for the current top 10 list.
What does that mean for you? When those giants rise, VOO gets a strong lift. When they fall hard, VOO feels it too, even with 500 stocks underneath. The fund is diversified by count, but the returns lean on a small group at the top.
How VOO has done since inception
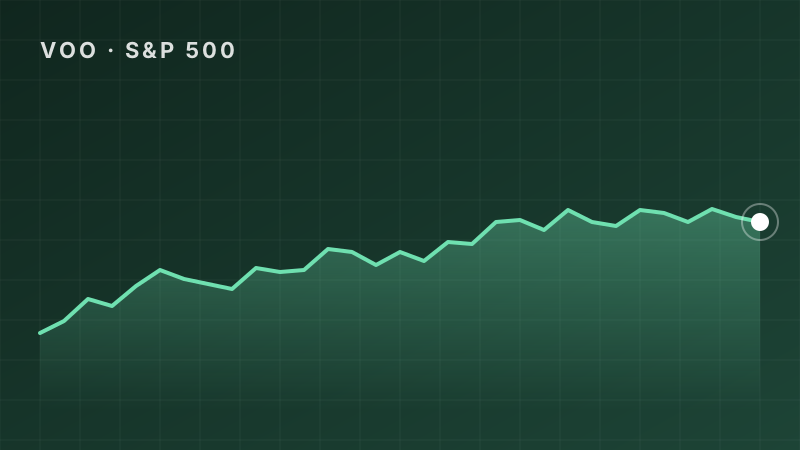
The headline number: 840% total return since 9/7/2010. Total return means price gains plus all dividends reinvested. Here is the growth math. If you had put $10,000 in at inception, it would be worth about $94,000 today.
The price decay flag for VOO reads No. That is what you want to see in a growth fund. Its share price has not been eroding over time, which is the main trap with high-yield funds I warn about all the time.
One caution: this is a backward look. It covers a long stretch where US large caps and especially tech did very well. It does not promise the next stretch will look the same.
Fees: tiny, but still worth seeing
On $10,000, VOO's fee is $3 per year. On $100,000, it is $30 per year. That is almost nothing next to what actively managed funds charge. Compare that to SCHG, which charges 0.04%, a hair more but still very low.
Fees matter because they compound against you every year. I broke down the long-run effect in the expense ratio math article. With VOO, fee drag is not the thing to worry about.
The yield is a side note
VOO pays Quarterly, with a yield of 1.0%. On $10,000 that is about $100 a year. To collect $1,000 a month from the yield alone, you would need roughly $1,200,000 invested.
That is why I treat VOO as a growth holding. The payout is real, but it is small. Investors who want cash flow often pair it with a dividend fund or sell shares over time. If you are curious what that looks like with a classic dividend fund, see how much you need in SCHD for $1,000 a month.
VOO vs close alternatives
Remember that these funds started on different dates, so total return numbers are not a clean race.
VOO vs QQQ
QQQ tracks the Nasdaq-100, which is tech-heavy and holds far fewer stocks than the S&P 500. Its total return in our data is 1,611% against 840% for VOO, and it manages $501B. QQQ has been around much longer, so that number covers a longer window. Higher past returns came with a more concentrated, more volatile ride.
VOO vs VUG
VUG is Vanguard's growth fund. It leans toward faster-growing large companies instead of the whole market. Its total return is 1,276% and its assets are $235B. You get a stronger growth tilt, but you give up some of the balance VOO has from value and cyclical sectors.
VOO vs SCHG
SCHG is Schwab's US growth ETF, launched 12/11/2009, with a total return of 1,218% and a yield of 0.4%. It is cheap at 0.04%. It is a growth-only slice, while VOO is the whole large-cap market.
On the same $10,000 at each fund's own inception, VOO grows to $94,000 and SCHG to $131,800. Different start dates again, so treat that as context, not a verdict. For a wider look, see the Growth ETF Scoreboard or browse more growth ETFs on GrowthETFs.com.
The main risks
- Market risk. VOO falls when the US stock market falls. In a bad year, it can drop sharply, and there is no cushion.
- Concentration. A few mega-cap stocks carry a lot of weight, so the fund is more tied to them than 500 holdings suggests.
- US only. You get no direct international exposure. Funds like VEU cover the rest of the world, with a total return of 182% in our data over its own window.
- Low income. At 1.0%, it will not pay your bills on its own.
Who VOO fits, and who should skip it
VOO tends to fit long-term investors who want broad US exposure, a very low fee and a hands-off approach. It works as a core holding for people building wealth over decades, especially if they reinvest dividends. If that idea appeals, read what turning on DRIP does over 20 years.
It may not fit people who need high current income, want strong international diversification, or want a bigger bet on one theme like tech or AI. It also may not suit anyone who cannot stomach a large drawdown. That is not advice, just the trade-offs as I see them.
Reality check: how little income a growth fund throws off
Estimated annual income at each fund's current yield
Today's income only. Yields change and are not guaranteed.
FAQ
What does VOO track?
VOO tracks the S&P 500, an index of about 500 of the largest US companies, weighted by market value. It is run by Vanguard.
Does VOO pay dividends?
Yes. VOO pays Quarterly and currently yields 1.0%. That is small, so most of the return comes from price growth.
Is VOO a good investment?
It has a long record of total return (840% since inception) and a very low 0.03% fee. Whether it is right for you depends on your goals and risk tolerance. This isn't a buy or sell signal.
VOO vs QQQ: which has the higher return?
QQQ shows 1,611% against 840% for VOO in our data, but the funds started on different dates and QQQ is much more tech-concentrated.
How much does VOO cost to own?
The expense ratio is 0.03%, which works out to $3 per year on $10,000.
Benjie's bottom line
VOO is not exciting, and that is the point. You get the US large-cap market, a 0.03% fee, $1.04T in assets and a long record of total return. The trade-offs are real: market risk, a top-heavy list of mega-cap names, and a yield of only 1.0%.
If you want to compare it against income options, check out TopDividendETFsPRO or play with the numbers in our calculators. As always, do your own due diligence.
ETFs in this story
How this article was made: Benjie picks every topic based on what he finds useful as a dividend investor and what readers ask about. Parts of this article were drafted with help from AI tools, then edited, fact-checked and shaped by Benjie. All fund numbers come from the TopETFs database and update daily.
Disclaimer: TopETFs.com is published by Dividend Empire LLC for educational and entertainment purposes only. We are not financial advisors, and nothing on this site is financial advice, a recommendation, or a solicitation to buy or sell any security. ETF data is compiled from public sources and fund issuers, may be delayed, inaccurate or outdated, and may differ from the fund sponsor's own figures. Yields are trailing distribution yields, are not guaranteed, and distributions may include return of capital, which reduces your cost basis and is not a measure of performance. Total returns are since each fund's inception unless noted and are not comparable across funds with different start dates. Past performance does not guarantee future results. Investing carries risk, including loss of principal. Read each fund's prospectus and consult a licensed financial advisor before investing. Dividend Empire LLC receives compensation from ETF issuers for sponsored placements, which are labeled as such.