Leveraged ETF Decay: Why TQQQ Can Lose Money Even When QQQ Rises
Leveraged ETF decay explained with real numbers: how TQQQ can lose money while QQQ rises, what daily resets do, and who these funds actually fit.
The short version
- TQQQ aims for three times the daily move of the Nasdaq-100, and it resets every day. That reset is why it can lose money over a stretch where QQQ finishes higher.
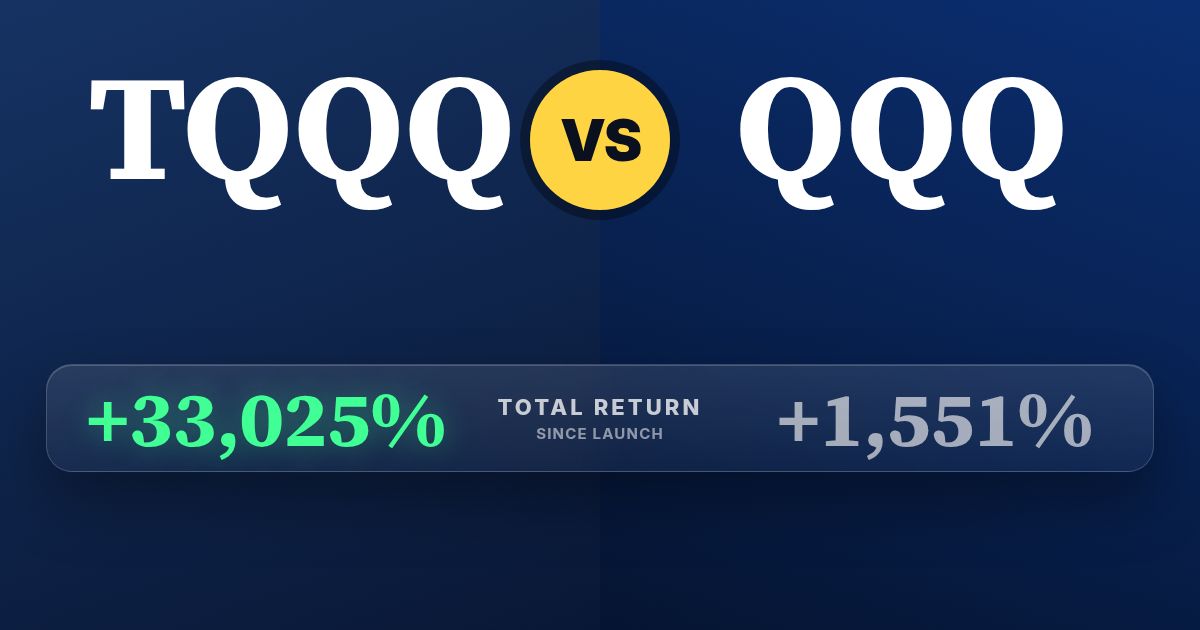
- Since inception, TQQQ's total return is 30,983% versus 1,519% for QQQ. Those numbers are real, but the funds started at very different times, so they are not a fair race.
- Decay is not a fee. It is math that hurts you most when markets chop sideways and swing up and down, and helps you when a trend runs in one direction.
Leveraged ETF decay is the slow erosion that happens because a leveraged fund rebuilds its exposure every single day. If the Nasdaq-100 swings up and down, TQQQ can end a period lower even though QQQ ended it higher. Since inception TQQQ's total return is 30,983% against 1,519% for QQQ, so the long-run story can look amazing. The path you take to get there is the part that bites.
TQQQ vs QQQ and plain growth funds
What TQQQ actually promises
TQQQ is built to deliver roughly three times the one-day return of the Nasdaq-100, the same index QQQ tracks. Notice the words "one-day." The fund does not promise three times the return over a week, a month or a year. It promises three times each day, and then it starts over.
To do that, the fund uses derivatives such as swaps and futures to get leveraged exposure, and it rebalances daily. Borrowing costs and fund expenses sit on top. Those costs are real, but they are not the main source of decay.
QQQ is the plain version. It holds the Nasdaq-100 stocks with no leverage and no daily reset. If you want the full breakdown of that fund, I covered it in the QQQ ETF review.
Why decay happens: the math in plain English
Gains and losses do not add up the way your gut thinks they do. Fall from 100 to 90 and you need to climb back more than 10 points, because you are now climbing from a smaller base. Leverage magnifies that problem because the swings are three times bigger.
Here is a made-up example. It is not fund data, just a clean illustration. Say the index starts at 100, has a strong up day that takes it to 110, then has a down day that brings it right back to 100.
| Path | Index (starts at 100) | 3x daily fund (starts at 100) |
|---|---|---|
| Day 1: strong up day | 110 | 130 |
| Day 2: index falls back to its start | 100 | About 94.5 |
| Net result | Flat, back at 100 | About 5.5 points below where it began |
The index is right back where it started. The leveraged fund is more than five points underwater. Same two days, same path for the index, very different outcome for the fund.
Now repeat that up-and-down pattern one more time. The index is still sitting at 100. The 3x fund is down to roughly 89. That is decay compounding on itself.
It cuts both ways
Here's the part people skip when they only warn about decay. In a steady trend, the same math works in your favor. Say the index climbs from 100 to 110 and then to 121 over two days. It gained 21 points. A 3x daily fund goes from 100 to 130 and then to 169, a gain of 69 points, which is more than three times the index's gain.
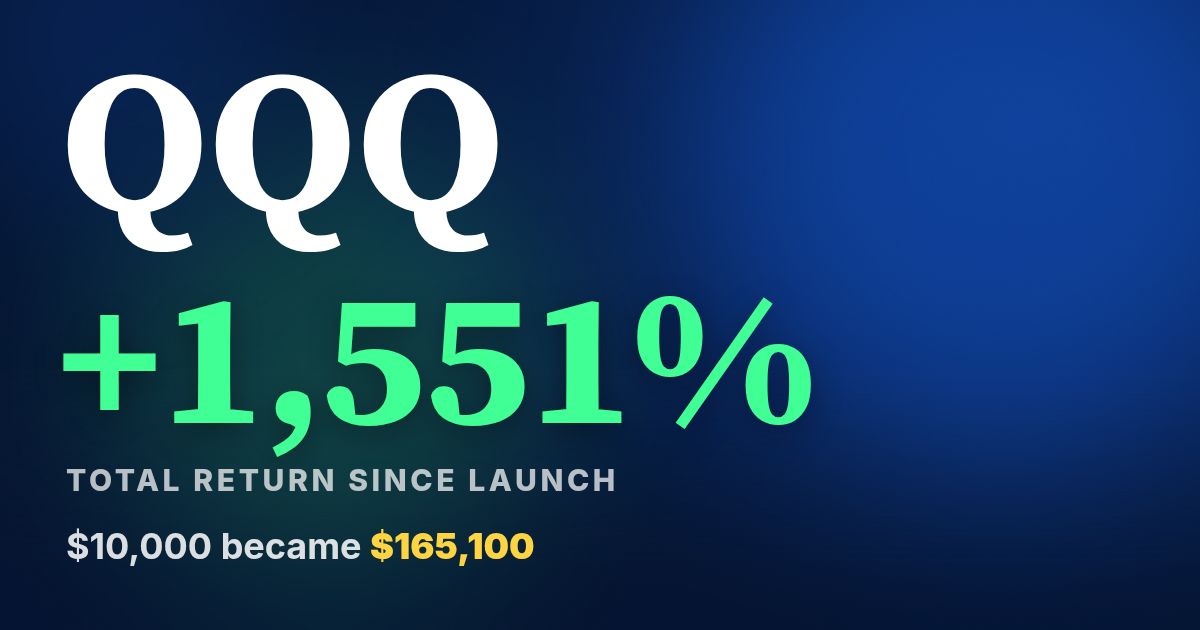
That explains the huge number you see in the table. TQQQ's total return since inception is 30,983%. Put in dollars, $10,000 invested at the start and held would now be $3,108,300. The same $10,000 in QQQ over its own, much longer history would be $161,900.
Please read those two figures carefully. QQQ has been around far longer than TQQQ, so the clocks are different. And TQQQ's run happened during a long stretch where the Nasdaq-100 mostly trended up. That is the best environment a leveraged fund can get. It does not tell you what happens in a choppy or falling market.
The drawdown problem
Decay is annoying. A big drawdown is dangerous. When a fund loses half its value, it needs to double just to get back to where it started. A 3x fund falls much faster than the index does in a bad stretch, so the hole gets deep quickly.
A steep, sustained decline in the Nasdaq-100 can wipe out most of a leveraged fund's value. And because of the daily reset, the fund does not bounce back in a straight line when the index recovers. You can watch QQQ climb back toward its old high while TQQQ is still well below its own.
That is the real answer to the search question. TQQQ can lose money when QQQ rises because of volatility and sequence of returns, not because anyone is hiding a fee from you.
TQQQ vs QQQ: size, scale and what the numbers say
Both funds are big. TQQQ has $36.6B in assets, while QQQ has $487B. Plenty of people are using TQQQ, which is exactly why it is worth understanding before you do.
On total return since inception, TQQQ shows 30,983% and QQQ shows 1,519%. Remember that these figures start on different dates. For a head-to-head on the unleveraged side, see VOO vs QQQ.
Both hold the same kind of stocks, which means the same tilt: large technology and growth companies, with a handful of mega-cap names carrying a lot of the weight. Leverage does not diversify that. It just turns the volume up on the same concentration.
How plain growth funds compare
If your goal is long-term growth without the daily-reset problem, there are many unleveraged options in our database. VUG has a total return of 1,211% since inception, and VGT, the tech-heavy one, shows 2,235%. SCHG shows 1,141%, and VOO, the broad S&P 500 fund, shows 823%. Again, each started in a different year.
Fees are another place where plain funds win clearly. VOO charges 0.03%, which is about $3 per year on $10,000. SCHG charges 0.04%, or $4 per $10,000. Leveraged funds generally charge noticeably more than that, and they carry financing costs on top. Check TQQQ's current fee on its fund page before you compare.
For a bigger scoreboard, look at what $10,000 became in the biggest growth funds and our list of the best growth ETFs. You can also browse more at GrowthETFs.com.
A quick income reality check
Growth funds are not income funds, and leveraged ones even less so. Yield is a side note here. VOO yields 1.1%, which is only $110 a year on $10,000. SCHG yields 0.4%, or $40 a year on the same amount. Both pay Quarterly distributions.
If you want a paycheck from your portfolio, a leveraged growth fund is the wrong tool. Whatever small distribution it makes does not offset the swings in the share price.
Reality check: how little income growth funds throw off
Estimated annual income at each fund's current yield
Today's income only. Yields change and are not guaranteed.
Risks to be honest about
- Volatility drag: choppy markets erode a daily-reset fund even when the index is flat or slightly up.
- Big drawdowns: three times the downside means a bad stretch can do severe, sometimes permanent damage.
- Concentration: the Nasdaq-100 leans on a small group of huge technology names, and leverage amplifies that.
- Holding period mismatch: these funds are designed around a single day. Holding for years is a different bet than the fund is built to match.
- Backward-looking totals: a huge since-inception return does not mean a buyer today will see the same thing.
Who leveraged funds tend to fit
These funds tend to fit experienced, active traders who watch positions closely, understand the daily reset and size their positions small enough that a large loss will not hurt. They are a tool, not a core holding.
Long-term buy-and-hold investors usually look at plain index funds like QQQ, VOO or VUG instead. They are cheaper, simpler and do not need babysitting. If you want to learn how ETFs work under the hood first, start with ETFs 101.
None of this is a buy or sell signal. It is just how the math works, so you can decide with your eyes open.
FAQ
Can TQQQ lose money when QQQ goes up?
Yes. Because TQQQ resets its leverage daily, a volatile path can leave it lower even if QQQ finishes higher over the same period. The up-and-down swings compound against it.
Is leveraged ETF decay a fee?
No. Decay comes from daily compounding in a volatile market, not from a charge on your account. Fund expenses and borrowing costs exist too, but they are separate from the compounding effect.
Is TQQQ a good long-term investment?
It depends on your goals and risk tolerance. TQQQ's total return since inception is 30,983%, but it came with severe drawdowns and the path matters a lot. Many long-term investors prefer unleveraged funds.
TQQQ vs QQQ: which has the higher total return?
Since inception TQQQ shows 30,983% and QQQ shows 1,519%. The funds launched at different times, so it is not a like-for-like comparison.
Does TQQQ pay a meaningful dividend?
Income is not the point of this fund. Any distribution is small compared with the swings in the share price, so check the current figures on its fund page.
Benjie's bottom line
Leveraged ETF decay is real, but it is not a trick. It is what happens when you rebuild three times the exposure every day and the market zigzags. The same math that grinds a leveraged fund down in a choppy market can supercharge it in a clean trend.
My take: understand the daily reset before you ever touch one of these, and never judge it by the since-inception number alone. For a simple look at plain alternatives, run the numbers in our calculators and do your own due diligence. This isn't financial advice.
ETFs in this story
How this article was made: Benjie picks every topic based on what he finds useful as a dividend investor and what readers ask about. Parts of this article were drafted with help from AI tools, then edited, fact-checked and shaped by Benjie. All fund numbers come from the TopETFs database and update daily.
Disclaimer: TopETFs.com is published by Dividend Empire LLC for educational and entertainment purposes only. We are not financial advisors, and nothing on this site is financial advice, a recommendation, or a solicitation to buy or sell any security. ETF data is compiled from public sources and fund issuers, may be delayed, inaccurate or outdated, and may differ from the fund sponsor's own figures. Yields are trailing distribution yields, are not guaranteed, and distributions may include return of capital, which reduces your cost basis and is not a measure of performance. Total returns are since each fund's inception unless noted and are not comparable across funds with different start dates. Past performance does not guarantee future results. Investing carries risk, including loss of principal. Read each fund's prospectus and consult a licensed financial advisor before investing. Dividend Empire LLC receives compensation from ETF issuers for sponsored placements, which are labeled as such.