QQQ ETF Review: Total Return, Fees, Holdings and Who It Fits
A plain-English QQQ ETF review: total return since inception, fees, tech concentration, risks and how it stacks up against VOO, VUG and SCHG.
The short version
- The QQQ ETF tracks the Nasdaq-100 and has returned 1,519% since inception, with $487B in assets.
- It is a growth fund, not an income fund. The yield is small, so the story is price gains, tech concentration and the swings that come with both.
- It is a bigger bet on a handful of mega-cap tech names than a plain S&P 500 fund like VOO, and the fee is higher than the cheapest index funds.
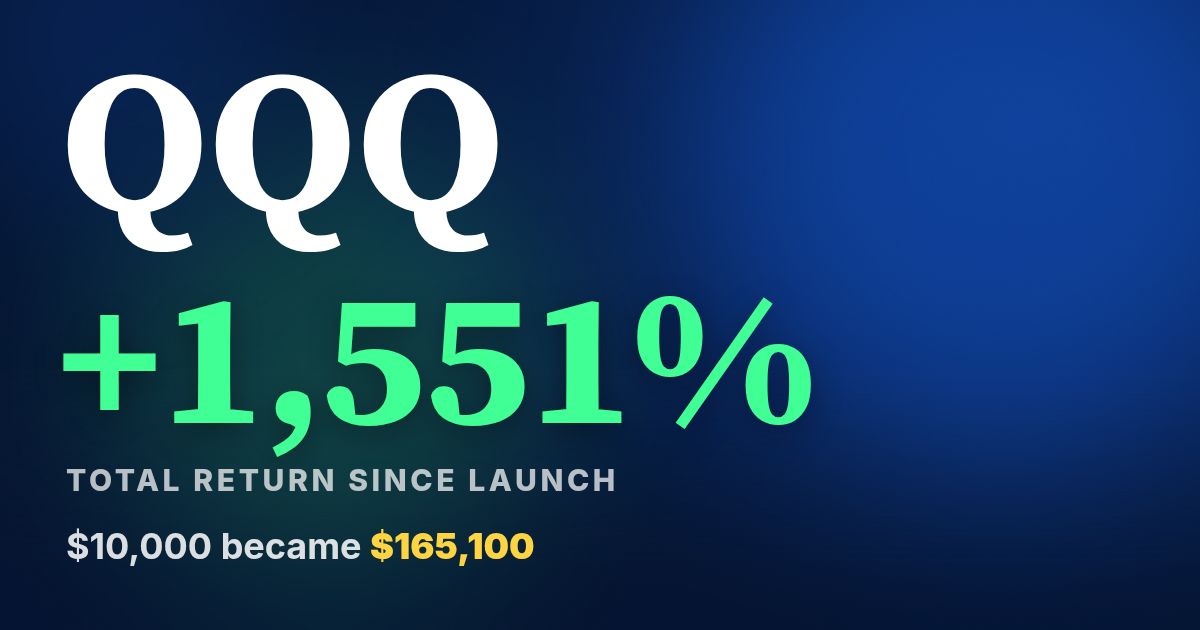
The QQQ ETF (Invesco QQQ Trust) is a fund that tracks the Nasdaq-100, the 100 largest non-financial companies listed on the Nasdaq exchange. Since inception it has produced a total return of 1,519%, which turns $10,000 into roughly $161,900, and it now holds $487B in assets. Here is what is inside it, what it costs, where it has risks, and who it fits.
QQQ vs close growth alternatives
What QQQ is and who runs it
QQQ is issued by Invesco. It has been around since the late 1990s, which makes it one of the oldest and best-known ETFs in the market. It started as a unit investment trust, and that history is why the name still says "Trust."
It is a passive fund. There is no manager picking stocks. It owns the companies in the Nasdaq-100 index and follows the index as it changes. If you want the plain-English basics of how an ETF works under the hood, I walk through it in ETFs 101: How an ETF Actually Works.
One thing that trips people up: the Nasdaq-100 is not the same as the Nasdaq Composite, and it is not the same as the S&P 500. It is a narrower list of 100 names, and it leaves out financial companies like banks and insurers.
Strategy and holdings: what you actually own
The index is weighted mostly by company size, with some rules that limit how dominant the very largest names can get. That means the biggest companies drive the results. In practice, the top of the fund is a who's who of mega-cap tech and tech-adjacent names: Nvidia, Microsoft, Apple, Amazon, Broadcom, Meta, Alphabet and Tesla have all been among the heavyweights in recent years. Exact weights move around, so check Invesco's site for the current list.
Here is the honest takeaway. Even though QQQ holds 100 stocks, the top handful can account for a very large share of what happens to your money on any given day. Owning 100 names does not mean you are evenly spread across 100 bets.
The sector tilt is heavy toward technology, communication services and consumer discretionary, with much less in areas like energy, utilities or financials. That is the whole appeal and the whole risk in one sentence.
Live numbers: total return, fees and size
Let's start with growth, because that is why people own this fund. QQQ's total return since inception is 1,519%. On a $10,000 start, that is about $161,900 today.
Now the caveat. QQQ launched many years before most of the funds I compare it to, so its number covers a much longer stretch, including the dot-com crash and the long run since. Do not line it up against a fund that started in 2010 and call it a fair race.
On fees, QQQ charges more than the rock-bottom index funds. VOO charges just 0.03%, which is about $3 per year on $10,000. SCHG charges 0.04%, or $4 per year on the same amount. QQQ's current expense ratio is in the live table above, and it sits higher than both. On a large balance held for decades, that gap compounds, so it is worth knowing about. Whether the Nasdaq-100 tilt is worth that extra cost is your call.
Assets are enormous: $487B. That size means tight trading spreads and very easy buying and selling, which is a real practical benefit.
How QQQ has done since inception
The long-term record is strong. Mega-cap tech has been the engine of the U.S. market for a long time, and QQQ has owned it with a heavy weighting. A 1,519% total return is a big number.
But the ride has not been smooth. A tech-heavy fund can fall hard when growth stocks go out of favor. Early 2000s investors learned that the painful way, and the 2022 selloff reminded everyone again. Strong long-term returns do not erase deep drawdowns along the way, and a big drawdown is exactly when many people sell at the worst time.
Also, past results are not a forecast. The same concentration that helped QQQ when mega-cap tech led can work against it if leadership shifts.
The yield is a side note
QQQ does pay distributions, and it pays them quarterly. But the yield is low, because the companies in the index mostly reinvest profits instead of paying them out. If you are here for monthly checks, this is the wrong tool. For comparison, even the broad VOO yields only 1.1%, and SCHG yields 0.4%.
Reality check: how little income growth funds throw off
Estimated annual income at each fund's current yield
Today's income only. Yields change and are not guaranteed.
Put numbers on it. $10,000 in VOO throws off about $110 a year. $10,000 in SCHG throws off about $40. To collect $1,000 a month from VOO's yield alone, you would need around $1,090,909 invested. Growth funds are built for the share price to do the work, not the dividend.
How QQQ compares to close alternatives
QQQ vs VOO. VOO holds the 500 largest U.S. companies and has a total return of 823% since its 9/7/2010 inception, with a fee of 0.03%. It is broader, cheaper and calmer. QQQ is narrower, more tech-heavy and has historically had bigger swings in both directions. I break this matchup down in VOO vs QQQ, and there is a standalone VOO ETF review too.
QQQ vs VUG. VUG is Vanguard's large-cap growth fund. It has a total return of 1,211% since its own inception, and $230B in assets. It leans growth too, but it picks from a broader universe than just the Nasdaq-100, so it is less tied to one exchange's list.
QQQ vs SCHG. SCHG is Schwab's growth fund, with a total return of 1,141% since 12/11/2009, a fee of 0.04%, and $63.8B in assets. It is a low-cost way to get U.S. large-cap growth, and it pays Quarterly.
A more concentrated option. VGT is a pure technology sector fund, with a total return of 2,235% since its inception. That is higher than QQQ's number, but it is a sector bet, so the concentration is even sharper.
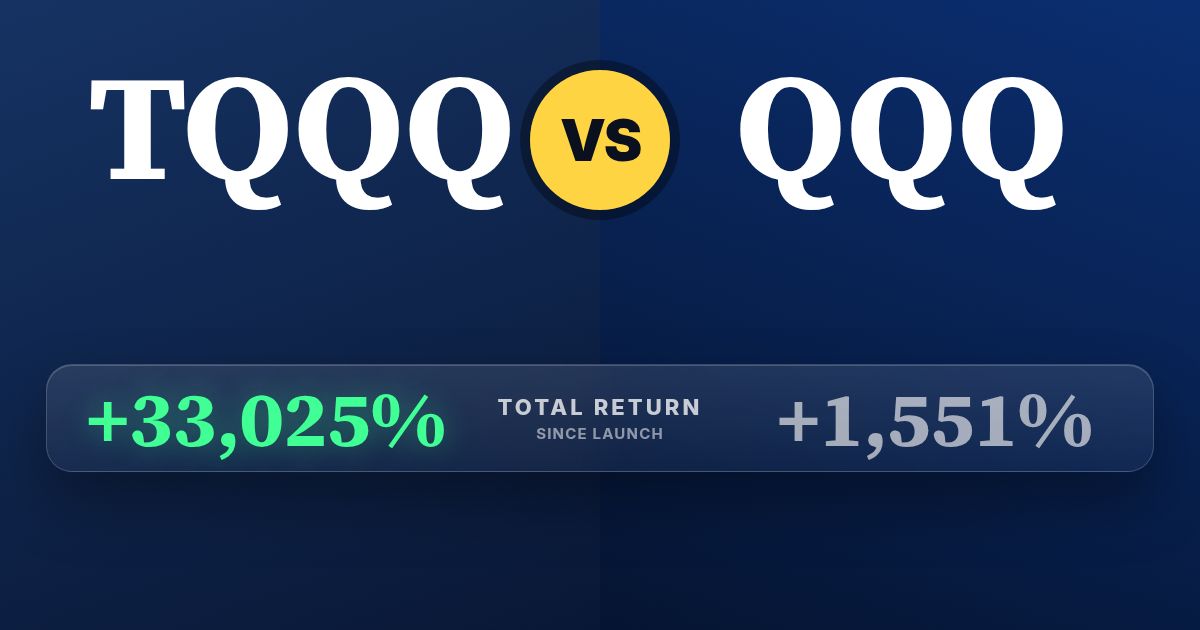
And a warning about TQQQ. It shows a total return of 30,983%, which looks wild next to everything above. It is a leveraged fund that aims for a multiple of QQQ's daily move. Leverage cuts both ways, resets daily, and can erode over time in choppy markets. It is a trading tool, not a cousin of QQQ you can hold the same way.
Remember the caveat that matters for every comparison here: these funds launched in different years, so their total returns cover different periods. For more side-by-side numbers, see the Growth ETF Scoreboard and The Best Growth ETFs by Total Return, Fees and Size.
The main risks
- Concentration. A few giant companies drive most of the result. If they stumble, QQQ feels it.
- Sector tilt. Heavy tech and communication exposure, little in defensive sectors.
- Valuation risk. Growth stocks are priced for strong future earnings. If expectations slip, prices can drop fast.
- Drawdowns. Big falls can last a long time. You need the stomach and the time horizon to sit through them.
- Fee gap. Higher than the cheapest index funds, and it compounds over decades.
Who QQQ fits, and who should skip it
QQQ tends to fit investors with a long time horizon who want more growth exposure than the broad market, who understand they are leaning into tech, and who do not need income from the portfolio today. It can work as a core holding for someone comfortable with volatility, or as a growth tilt on top of a broad index fund.
It tends to fit poorly for retirees who live off portfolio income, anyone who would panic-sell in a 30% or 40% drop, or investors who already own plenty of mega-cap tech through other funds. If you hold QQQ and VUG and a tech sector fund, you may own the same top names three times.
If you want to explore more growth funds, my network site GrowthETFs.com lists them, and the TopETFs calculators help you run the numbers on your own amounts.
FAQ
What is the QQQ ETF?
QQQ is Invesco's ETF that tracks the Nasdaq-100, the 100 largest non-financial companies on the Nasdaq. It is heavily weighted toward big tech.
Does QQQ pay dividends?
Yes, it pays distributions quarterly, but the yield is low. It is built for price growth, not income. Check the live table above for the current yield.
Is QQQ a good investment?
It has a strong long-term record, with a total return of 1,519% since inception. It also carries concentration risk and big drawdowns, so whether it is good depends on your time horizon and risk tolerance.
QQQ vs VOO: which is better?
VOO is broader and cheaper, with a fee of 0.03%. QQQ is more concentrated in tech and has historically been more volatile. Neither is better for everyone, and the two launched in different years, so compare with care.
How big is QQQ?
QQQ has $487B in assets, making it one of the largest ETFs in the world and very easy to trade.
Benjie's bottom line
QQQ is one of the clearest examples of a growth fund: a 1,519% total return since inception, a big pile of assets, and a portfolio that leans hard on a few mega-cap tech companies. The upside has been real. So is the concentration.
I would not judge it by the yield, because that is not the point. Judge it by how much tech you already own, what you pay in fees, and whether you could hold through a deep drop without bailing. This isn't a buy or sell signal. Do your own due diligence.
ETFs in this story
How this article was made: Benjie picks every topic based on what he finds useful as a dividend investor and what readers ask about. Parts of this article were drafted with help from AI tools, then edited, fact-checked and shaped by Benjie. All fund numbers come from the TopETFs database and update daily.
Disclaimer: TopETFs.com is published by Dividend Empire LLC for educational and entertainment purposes only. We are not financial advisors, and nothing on this site is financial advice, a recommendation, or a solicitation to buy or sell any security. ETF data is compiled from public sources and fund issuers, may be delayed, inaccurate or outdated, and may differ from the fund sponsor's own figures. Yields are trailing distribution yields, are not guaranteed, and distributions may include return of capital, which reduces your cost basis and is not a measure of performance. Total returns are since each fund's inception unless noted and are not comparable across funds with different start dates. Past performance does not guarantee future results. Investing carries risk, including loss of principal. Read each fund's prospectus and consult a licensed financial advisor before investing. Dividend Empire LLC receives compensation from ETF issuers for sponsored placements, which are labeled as such.