SCHG vs QQQ: Yield, Total Return, Fees and Which One Fits You
SCHG vs QQQ head to head: live total return, fees, assets, yield and what $10,000 became in each, plus which type of growth investor each one fits.

The short version
- Both funds are big, low-yield bets on large U.S. growth stocks. SCHG is a broad growth index with a tiny fee (0.04%), and QQQ is the Nasdaq-100 with far more assets ($487B).
- Total return since inception is 1,141% for SCHG and 1,519% for QQQ, but the two funds started at very different times, so that is not a fair race.
- Neither one is an income fund. SCHG yields 0.4%, so $100,000 throws off only about $400 a year.
SCHG vs QQQ comes down to this: SCHG is the cheaper, broader growth fund, and QQQ is the bigger, more concentrated Nasdaq-100 fund with the higher headline total return. SCHG has returned 1,141% since its 12/11/2009 start with a 0.04% expense ratio. QQQ shows 1,519% since its own, much earlier, start. Both pay almost nothing in income, so this is a total return decision.
SCHG vs QQQ and close growth alternatives
What each fund actually holds
Here's the thing: these two overlap more than most people expect. Both lean heavily on the same mega-cap technology and internet names, so owning both mostly means owning the same big companies twice.
SCHG is Schwab's U.S. large-cap growth fund. It tracks an index of large U.S. companies screened for growth characteristics, and it holds stocks listed on both the Nasdaq and the NYSE. The result is a broad growth basket with tech at the top, but with room for growth names in health care, consumer and industrial sectors.
QQQ tracks the Nasdaq-100, which is the 100 largest non-financial companies listed on the Nasdaq exchange. It is not a growth screen. It is simply whatever the biggest Nasdaq companies are, weighted by size. Because the Nasdaq is tech-heavy, QQQ ends up tilted hard toward technology and communication names, and the largest handful of holdings drive a big share of the result.
So the real difference is style versus exchange. SCHG picks growth stocks from the whole U.S. market. QQQ picks the biggest companies from one exchange, and growth is the byproduct. Check each issuer's fact sheet for current top holdings and sector weights, since those shift as prices move.
Total return: the number everyone quotes
Our data shows total return since inception, meaning price change plus reinvested distributions from the day each fund started trading. That is where the comparison gets tricky.
SCHG launched on 12/11/2009. QQQ has been trading far longer, and our database does not show a start date for it. So QQQ's 1,519% and SCHG's 1,141% cover different stretches of market history, with different starting prices and different crashes and recoveries along the way. Lining those two numbers up and declaring a winner would be misleading.
Still, the growth math is worth seeing. At today's totals:
- $10,000 in SCHG since inception became about $124,100.
- $10,000 in QQQ since its inception became about $161,900.
Both are strong numbers. But QQQ's clock started much earlier, and that includes a long stretch of compounding that SCHG simply wasn't around for. For a cleaner comparison, check both funds over the same window (say, the last 10 years) on a chart tool. Past performance does not predict what comes next, and that includes both of these funds.
Fees: small on paper, real over decades
SCHG charges 0.04% a year. On $10,000 that is $4 per year in fees. On $100,000 it is $40. That is about as cheap as growth investing gets.
QQQ's expense ratio isn't populated in our database right now, so I won't quote a number I can't verify. Check Invesco's fund page for the current figure. What I will say generally is that QQQ has historically charged more than SCHG, which is normal for a fund with a long track record and a huge trading base.
Does that gap matter? Over a few years, not much. Over 20 or 30 years on a large balance, a fee difference compounds like any other drag. That is why I always look at the expense ratio even when a fund's total return looks great. Fees are one of the few things you can control.
Assets and trading: where QQQ shines
QQQ holds $487B in assets. SCHG holds $63.8B. Both are very large, so liquidity and closure risk are not real concerns for either.
QQQ is one of the most heavily traded ETFs in the world, which usually means very tight bid/ask spreads. It is also popular with options traders, which adds activity. For a long-term buy-and-hold investor, that trading volume matters less. For someone who trades in and out or uses options, it matters a lot.
SCHG is also easy to trade. Most long-term investors will never notice a liquidity difference between the two.
Yield and price decay: the side note
This is not why you own either fund. SCHG yields 0.4% and pays Quarterly. Our price decay flag for SCHG reads: No. That means the fund has not been eroding its share price over time, which is exactly what you want from a growth fund.
QQQ's yield isn't available in our database right now. The Nasdaq-100 is made up mostly of companies that pay small dividends or none at all, so QQQ's yield has historically been low, in the same tiny range as SCHG. Check Invesco for the live figure.
Here is what SCHG's yield means in dollars:
- $10,000 invested pays about $40 a year.
- $100,000 invested pays about $400 a year, or roughly $33 a month.
- To get $1,000 a month from SCHG's yield alone, you would need about $3,000,000.
That last number is the reality check. If income is the goal, a growth fund is the wrong tool. If you want to plan for that, try the Dividend Projection tool or the calculators on our tools page.
Reality check: how little income growth funds throw off
Estimated annual income at each fund's current yield
Today's income only. Yields change and are not guaranteed.
Risks both funds share
Neither fund is a safe harbor. Both are concentrated in a small number of very large companies, and both are tied to the U.S. market. If mega-cap tech stumbles, both will feel it.
QQQ carries a little more of that concentration risk by design. It holds only 100 stocks from one exchange, and the biggest few dominate. SCHG is broader and gets some diversification from non-Nasdaq names, but the top of its list still looks a lot like QQQ's.
Growth funds can also fall hard. When rates rise or sentiment flips, expensive growth stocks tend to drop more than the overall market. That is the trade-off for the higher long-run returns these funds have delivered so far. You need the stomach to sit through a big drawdown without selling.
How they compare to other growth options
If you like the idea of SCHG or QQQ, a few other funds in our data play in the same space:
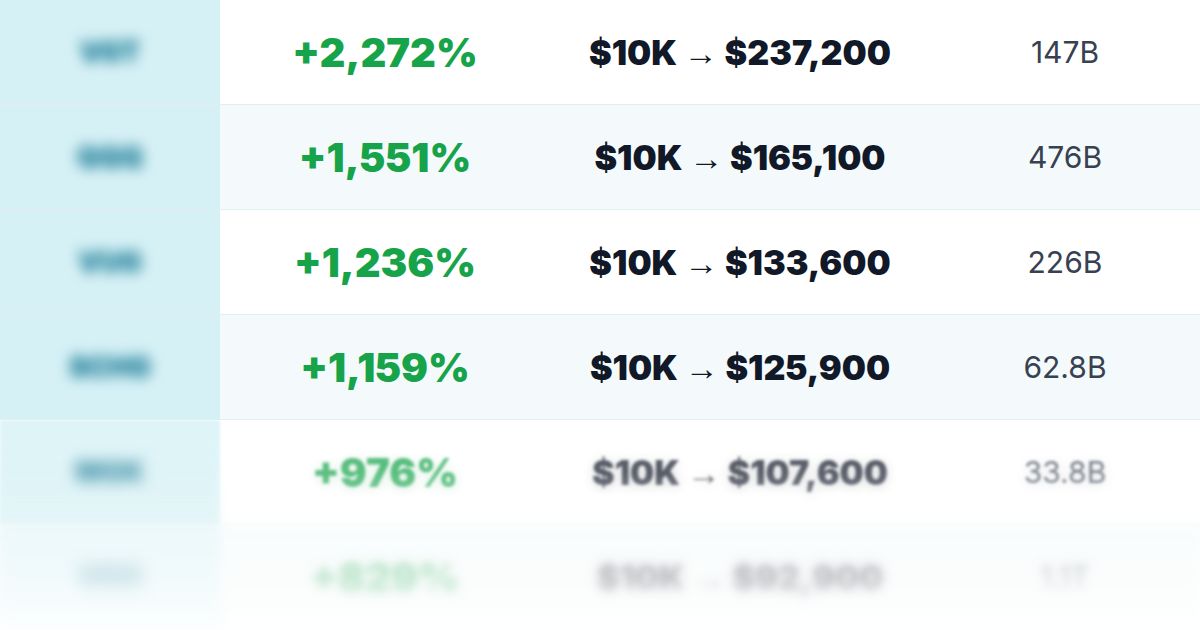
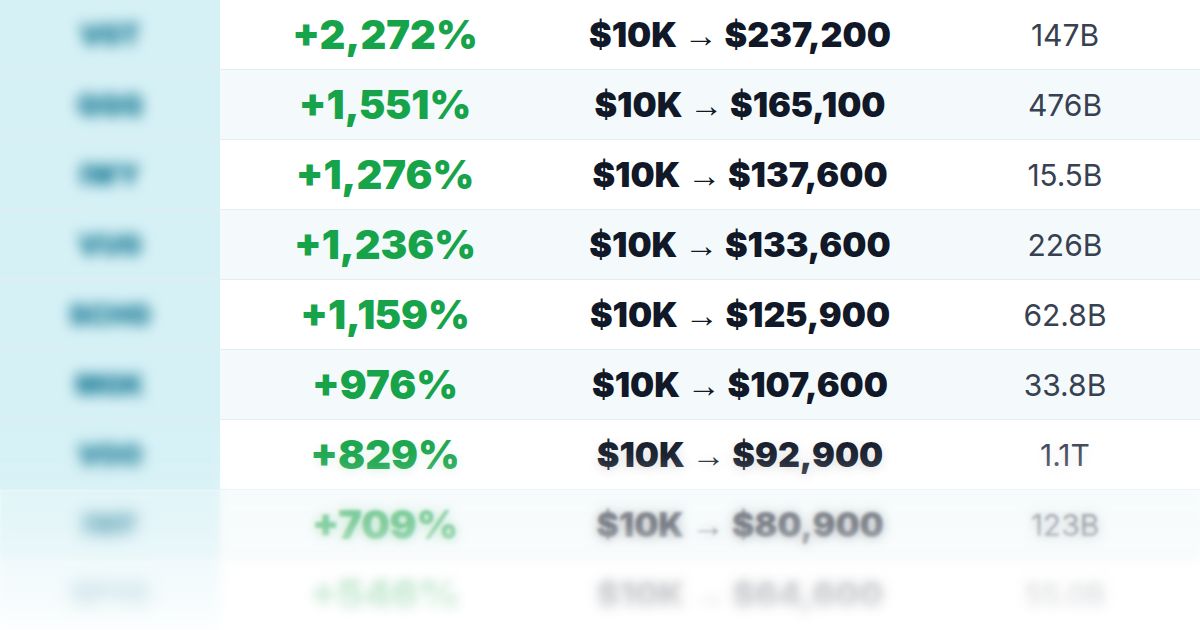
- VUG (total return 1,211%) is Vanguard's large-cap growth fund, a close cousin of SCHG.
- VONG (total return 1,019%) tracks the Russell 1000 Growth.
- VOOG (total return 1,063%) is the S&P 500 growth slice.
- VOO (total return 823%) is the plain S&P 500, with a fee of 0.03% and a yield of 1.1%.
Remember, those totals all start on different dates. For more on how the big names stack up, see the best growth ETFs by total return, fees and size and the Growth ETF Scoreboard. If you are weighing QQQ against the broad market, read VOO vs QQQ. For a deeper look at the Nasdaq-100 fund on its own, there is a full QQQ ETF review. And if you are tempted by leveraged versions, read this first.
Who each fund tends to fit
SCHG tends to fit the long-term, cost-conscious investor who wants broad U.S. growth exposure without paying much for it. If you are building a core growth holding and plan to hold for decades, the 0.04% fee and the broader index are the appeal. It also suits Schwab account holders who like keeping things in one place.
QQQ tends to fit the investor who wants direct exposure to the Nasdaq-100, accepts the heavier tech tilt, and values the size and trading depth of the biggest fund in the category. It is also the standard choice for anyone who trades options or wants a tight, liquid vehicle.
Neither fits someone who needs income now. For that, look at the screeners on GrowthETFs.com for more growth ideas, or go the other direction if cash flow matters more than appreciation.
FAQ
Is SCHG better than QQQ?
Neither is better in every way. SCHG is broader and charges 0.04%, while QQQ is larger and tracks the Nasdaq-100. Total return depends on the time period, and the two funds started on different dates.
Does SCHG pay dividends?
Yes, but not much. SCHG yields 0.4% and pays Quarterly, so $10,000 produces about $40 a year.
What is the difference between SCHG and QQQ?
SCHG holds large U.S. growth stocks from across the market. QQQ holds the 100 largest non-financial companies on the Nasdaq. They share many of the same top names, but QQQ is more concentrated.
Which has the higher total return, SCHG or QQQ?
Our data shows 1,519% for QQQ and 1,141% for SCHG since inception. QQQ has been trading much longer, so it is not an apples-to-apples comparison.
Should I own both SCHG and QQQ?
Most investors gain little from holding both, because the top holdings overlap heavily. Owning both mostly doubles up on the same mega-cap tech names.
My bottom line
SCHG and QQQ are two roads to the same neighborhood. SCHG gets you there cheaper and a bit more broadly. QQQ gets you there through the biggest, most traded Nasdaq fund on the market. Both have delivered big total returns since inception, and both pay almost nothing in income.
My advice: compare them over the same time window, check Invesco for QQQ's current fee and yield, and decide whether you want a growth screen or the Nasdaq-100 itself. This isn't a buy or sell signal, and growth funds can fall hard. Do your own due diligence.
ETFs in this story
How this article was made: Benjie picks every topic based on what he finds useful as a dividend investor and what readers ask about. Parts of this article were drafted with help from AI tools, then edited, fact-checked and shaped by Benjie. All fund numbers come from the TopETFs database and update daily.
Disclaimer: TopETFs.com is published by Dividend Empire LLC for educational and entertainment purposes only. We are not financial advisors, and nothing on this site is financial advice, a recommendation, or a solicitation to buy or sell any security. ETF data is compiled from public sources and fund issuers, may be delayed, inaccurate or outdated, and may differ from the fund sponsor's own figures. Yields are trailing distribution yields, are not guaranteed, and distributions may include return of capital, which reduces your cost basis and is not a measure of performance. Total returns are since each fund's inception unless noted and are not comparable across funds with different start dates. Past performance does not guarantee future results. Investing carries risk, including loss of principal. Read each fund's prospectus and consult a licensed financial advisor before investing. Dividend Empire LLC receives compensation from ETF issuers for sponsored placements, which are labeled as such.