MSTY vs ULTY: Yield, Total Return, Fees and Which Fits You
MSTY vs ULTY head to head: live yield, fees, assets, total return, price decay and weekly income on $10,000, plus which investor each one fits.

The short version
- MSTY and ULTY pay almost the same headline yield today (60.0% vs 61.0%), but they get there in very different ways.
- Since inception, MSTY has a total return of 44.0% while ULTY sits at -1.0%. They launched about a week apart, so this is close to an apples to apples comparison.
- Both carry a price decay flag. MSTY costs 0.99% a year and ULTY costs 1.40%.
MSTY vs ULTY comes down to concentration versus spread. MSTY sells options on a single stock, MicroStrategy, and yields 60.0%. ULTY spreads its option income across a basket of volatile stocks and yields 61.0%. On $10,000, that is roughly $115 a week from MSTY and $117 a week from ULTY, before any price change.
Here's the thing: that is only half the story. The yields look nearly identical, but total return since inception is not even close. Let's walk through why.
MSTY and ULTY vs other weekly payers
How each fund makes its weekly payout
Both funds are issued by YieldMax, and both use the same basic idea: collect option premium and pass it to shareholders. Option premium is the cash a buyer pays you for the right to profit if a stock moves a certain way. When you sell that right, you keep the cash.
MSTY targets MicroStrategy (MSTR). Instead of simply owning the stock, the fund uses options to build what's called a synthetic covered call. In plain English, that means it keeps much of the downside of the stock, gives up a chunk of the upside, and collects premium along the way. MSTR is a very volatile stock, and volatility is what makes option premium large. That is where the big yield comes from.
ULTY uses a similar options approach, but not on one name. It works across a rotating group of high-volatility stocks, and the manager can change what it targets over time. So the premium comes from many sources instead of one.
The fund pays Weekly for MSTY and Weekly for ULTY. Weekly sounds smooth, but the amount is not fixed. Each payout moves with how much premium the fund collected, so some weeks pay more and some pay less.
Yield, fees and assets side by side
MSTY yields 60.0% and ULTY yields 61.0%. That is a thin gap at the headline level. The fee gap is bigger. MSTY charges 0.99% and ULTY charges 1.40%.
On $10,000, the annual fee works out to $99 for MSTY and $140 for ULTY. Fees come out of the fund's returns, so a higher fee means a higher hurdle before you break even. If you want the long version of why this matters, I covered it in the expense ratio math article.
On size, MSTY holds $1.0B in assets and ULTY holds $625M. Both are large enough to trade easily, which matters for funds that people buy and sell actively.
The weekly, monthly and yearly income math
Let's put real money on it. These numbers use today's yield and assume it stays constant, which it won't. Treat it as a snapshot.
- $10,000 in MSTY: about $115 per week, $500 per month, $6,000 per year.
- $10,000 in ULTY: about $117 per week, $508 per month, $6,100 per year.
- $100,000 in MSTY: about $5,000 per month.
- $100,000 in ULTY: about $5,083 per month.
Want $1,000 a month? At today's yields that takes about $20,000 in MSTY or about $19,672 in ULTY. Those are big numbers for a small position, which is exactly why the yield is attractive and exactly why you need to look at what happens to the share price.
What your money earns in MSTY, ULTY and two other weekly payers
Estimated annual income at each fund's current yield
Today's income only. Yields change and are not guaranteed.
Total return: where the two funds split
Yield only tells you what the fund paid out. Total return adds the change in share price, so it tells you what you actually ended up with. Our data measures it since each fund's inception.
MSTY launched on 2/22/2024 and shows a total return of 44.0%. ULTY launched on 2/28/2024 and shows -1.0%. Because the start dates are only days apart, the gap of 45.0% is a fair read on how the two have done over roughly the same stretch.
Two things stand out. First, ULTY's total return is close to flat despite a yield of 61.0%. That means the share price losses have eaten up most of the income it paid. Second, MSTY's higher total return comes from a single-stock bet that has been rewarded so far. That can reverse. A fund tied to one volatile stock is only as good as that stock's path.
Past performance is not a forecast. But it is a useful reality check on the headline yield. I wrote more on this in why the biggest payout isn't always the best return.
Price decay and return of capital
Both funds carry a price decay flag in our data: MSTY shows Yes and ULTY shows Yes. Price decay means the share price (the NAV, or net asset value) has trended down over time. For an income fund, that is a warning sign, because you are being paid partly with your own principal shrinking.
It happens for a simple reason. A covered call style fund caps the upside but keeps the downside. In strong markets it misses gains. In weak markets it still falls. The premium helps cushion the drop, but over time the cap on upside can pull the share price lower while the payouts continue.
Related to this is return of capital, or ROC. That is when part of the distribution is technically a return of your own money instead of earnings. It is not automatically bad, and it can defer taxes in some cases, but it can also mean the fund is paying out more than it is truly earning. Tax treatment depends on your situation, so check with a professional. For the basics, see what return of capital means in an ETF and what price decay is.
Risks you should know about
- MSTY concentration risk: everything rides on one stock. If MSTR has a rough stretch, there is no other holding to soften it.
- ULTY manager risk: the basket and the strategy can change over time. You are trusting the manager's choices, and the higher fee reflects that active approach.
- Payout variability: weekly distributions can fall as volatility falls. The yield you see today is not a promise.
- Capped upside: in a big rally for the underlying stocks, you will not get the full move.
- Short track record: both funds are only a couple of years old, so we have not seen how they behave across a full market cycle.
How they compare to other weekly payers
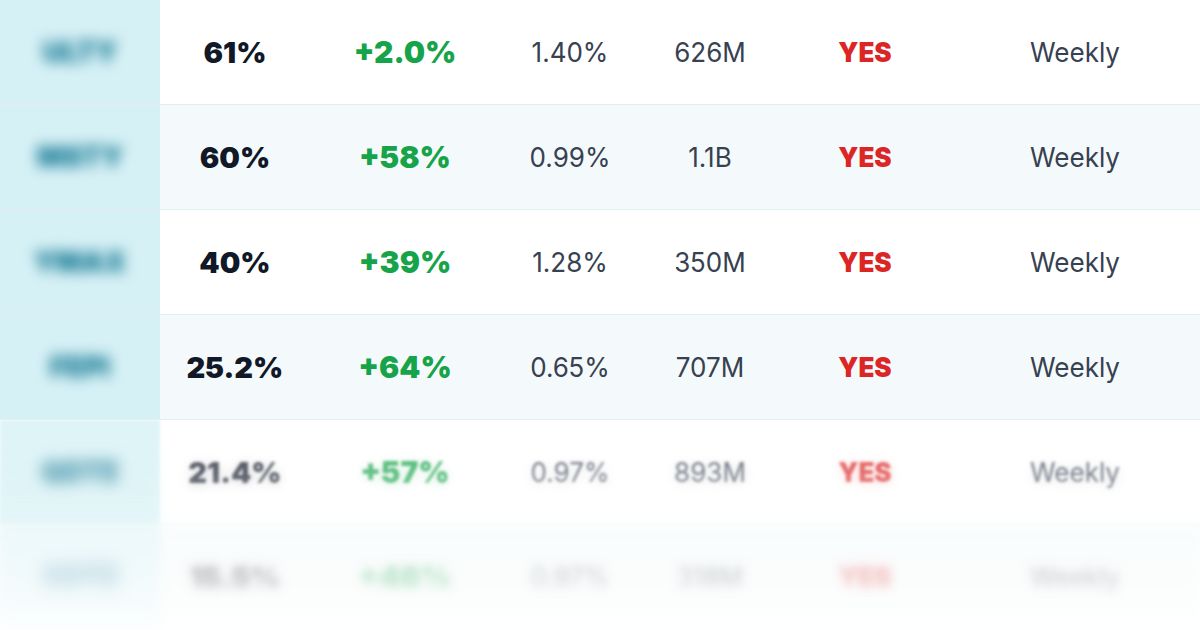
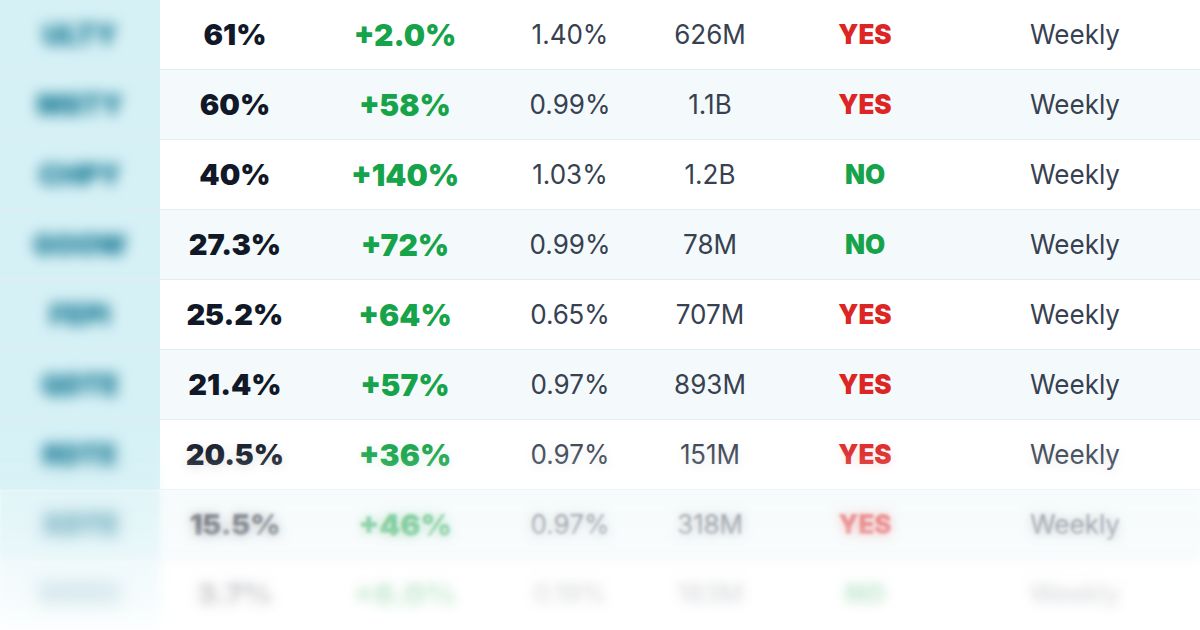
Both funds sit at the top of the yield range among weekly payers. CONY, which writes options on Coinbase, shows 55.0%. TSLY, tied to Tesla, shows 50.0%. Then it drops: NVDY shows 30.0% and the Roundhill fund QDTE shows 27.6%.
Lower yield is not automatically worse. NVDY's total return since inception is 332%, though it launched on 5/10/2023, well before MSTY and ULTY, so the comparison is not fair. CHPY, a semiconductor focused fund, yields 40.0% and shows a price decay flag of No, but it launched on 4/2/2025, so it has a much shorter history. FEPI charges only 0.65%, which is a lot lower than either fund in this matchup.
The pattern I keep seeing: the highest yields tend to come with the most single-name concentration and the most price risk. For a wider look, see the best weekly dividend ETFs, and you can browse every weekly payer at WeeklyETFs.com.
Which type of investor each one fits
This isn't a buy or sell signal. It's a way to see which trade-offs match your situation.
MSTY tends to fit someone who already has a view on MicroStrategy, understands that the fund is a single stock bet with options layered on top, and can stomach large swings. The fee is lower, and the track record so far is stronger, but that is no guarantee. Size it as a small slice, not the core of a portfolio.
ULTY tends to fit someone who wants high weekly income but does not want to depend on one company. The spread is a plus. The trade-off is a higher fee and a total return that has been close to flat so far. If your goal is cash flow and you plan to track NAV closely, it can make sense. If your goal is growth, the numbers so far are not encouraging.
Neither fits someone who needs stable income, a steady share price, or a place to park money they cannot afford to see drop. If that is you, look at lower yielding options with a cleaner record. You can screen the full list at TopDividendETFsPRO.
If you are planning around these payouts, run your own numbers in the weekly pay $10,000 breakdown. For single fund detail, see the MSTY deep dive and the ULTY deep dive.
FAQ
Is MSTY or ULTY the better investment?
It depends on what you want. MSTY has the higher total return since inception (44.0% vs -1.0%) and the lower fee, but it relies on one stock. ULTY is more spread out, but it has returned much less so far.
Which pays more, MSTY or ULTY?
Right now they are very close: 60.0% for MSTY and 61.0% for ULTY. Both numbers change as option premiums and share prices move.
Do MSTY and ULTY pay weekly?
Per our data, MSTY pays Weekly and ULTY pays Weekly. The amount varies from week to week.
Do MSTY and ULTY have price decay?
Yes, both are flagged for price decay in our database. That means the share price has trended lower over time, which can offset part of the income you receive.
What does $10,000 earn in MSTY vs ULTY?
At current yields, about $6,000 a year in MSTY and about $6,100 a year in ULTY, before any change in share price. Yields are not guaranteed.
Which has the lower expense ratio?
MSTY charges 0.99% and ULTY charges 1.40%, so MSTY is cheaper to hold.
Benjie's bottom line
The yields on MSTY and ULTY look like twins. The results do not. One has delivered a total return of 44.0% and the other -1.0% over close to the same period, and both are flagged for price decay. That tells you the yield is only the starting point.
If you use either one, size the position small, watch total return instead of just the payout, and be honest about whether you are collecting income or slowly returning your own capital to yourself. Do your own due diligence, and remember that this is not a recommendation to buy or sell anything. For more weekly payers to compare, head to WeeklyETFs.com.
ETFs in this story
How this article was made: Benjie picks every topic based on what he finds useful as a dividend investor and what readers ask about. Parts of this article were drafted with help from AI tools, then edited, fact-checked and shaped by Benjie. All fund numbers come from the TopETFs database and update daily.
Disclaimer: TopETFs.com is published by Dividend Empire LLC for educational and entertainment purposes only. We are not financial advisors, and nothing on this site is financial advice, a recommendation, or a solicitation to buy or sell any security. ETF data is compiled from public sources and fund issuers, may be delayed, inaccurate or outdated, and may differ from the fund sponsor's own figures. Yields are trailing distribution yields, are not guaranteed, and distributions may include return of capital, which reduces your cost basis and is not a measure of performance. Total returns are since each fund's inception unless noted and are not comparable across funds with different start dates. Past performance does not guarantee future results. Investing carries risk, including loss of principal. Read each fund's prospectus and consult a licensed financial advisor before investing. Dividend Empire LLC receives compensation from ETF issuers for sponsored placements, which are labeled as such.