SPYI vs JEPI: Yield, Total Return, Fees and Which One Fits You
SPYI vs JEPI compared with live yield, fees, assets, total return since inception, price decay and what each pays on the same investment.

The short version
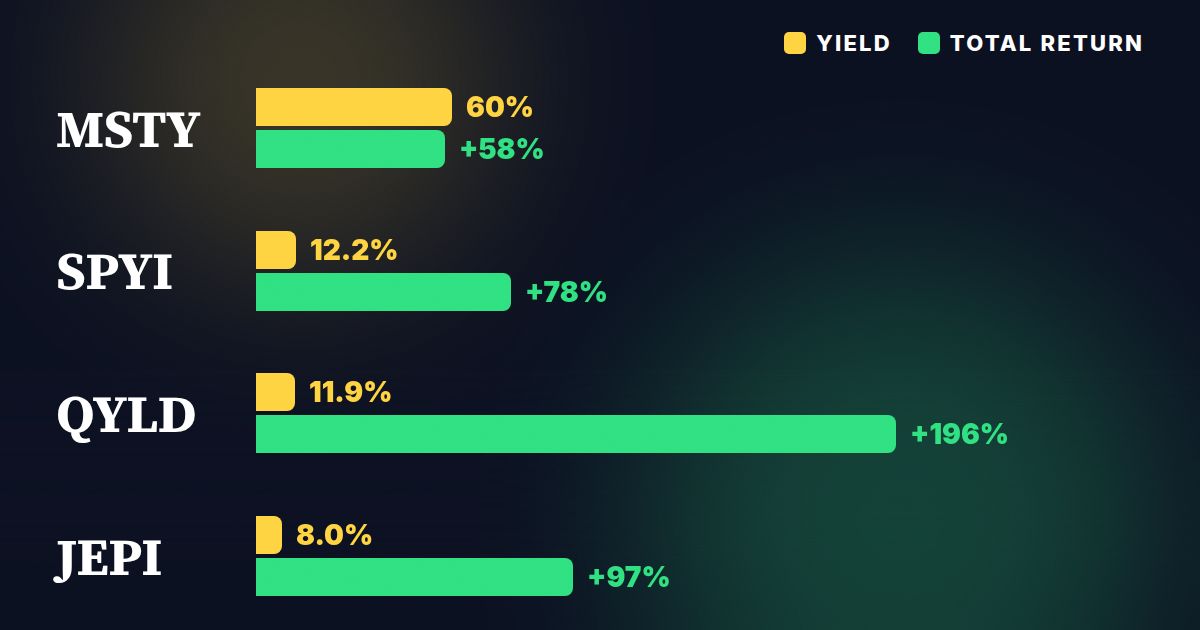
- SPYI yields 12.2% and JEPI yields 8.0%, so SPYI pays more cash today, but it also costs 0.68% versus 0.35% for JEPI.
- JEPI has a higher total return since inception (98.0% vs 77.0%), but it launched more than two years earlier, so the comparison is not apples to apples.
- Both are monthly payers and neither is flagged for price decay right now. SPYI tends to fit people who want maximum income, JEPI tends to fit people who want a lower fee and a smoother ride.
In the SPYI vs JEPI matchup, SPYI pays the bigger yield (12.2% vs 8.0%), while JEPI is cheaper (0.35% vs 0.68%), much larger ($45.9B vs $12.7B) and has the higher total return since inception (98.0% vs 77.0%). Both pay monthly and both are built on S&P 500 style stock exposure plus option income.
SPYI vs JEPI next to close alternatives
How SPYI and JEPI make their income
Both funds are covered call style income funds. In plain English, that means they hold stocks and also sell call options, which are contracts that pay the fund a premium upfront in exchange for giving up some of the stock market's upside. That premium is a big part of what gets paid out to you. If you want the full breakdown, I wrote about it in Covered Call ETFs, Explained.
The way they do it is different, though.
SPYI: S&P 500 exposure with index options
SPYI is run by NEOS. It holds a portfolio of large U.S. stocks that tracks the S&P 500 and writes call options on the S&P 500 index itself. Index options of that type can qualify for Section 1256 tax treatment, which is the reason a lot of investors in taxable accounts look at it. Tax outcomes depend on your situation, so read Section 1256 ETFs and Taxes and check with a tax professional.
JEPI: a defensive stock basket plus equity-linked notes
JEPI comes from JPMorgan. It is actively managed. It holds a portfolio of U.S. large caps that is selected to be less volatile than the broad market, then gets its option income through equity-linked notes (ELNs), which are debt instruments that bundle in the option exposure. The result is a fund that usually behaves a bit more defensively than a plain S&P 500 fund, and that gives up more of the upside in strong rallies.
The practical takeaway: neither fund is a pure S&P 500 tracker, and neither will fully keep up when the market rips higher. That is the price of the income.
Yield, fees and size side by side
Here is how the basics stack up today. SPYI yields 12.2% and JEPI yields 8.0%. SPYI's expense ratio (the yearly fund fee taken out of assets) is 0.68%, and JEPI's is 0.35%. On a $10,000 position, that works out to about $68 a year in fees for SPYI and $35 for JEPI.
Fees are already baked into the share price and the payout, so you will never see them as a bill. But they do matter over time, and SPYI's higher yield is partly the reward for taking its particular strategy, not a free lunch.
Size is another difference. JEPI manages $45.9B and SPYI manages $12.7B. Bigger is not automatically better, but JEPI's scale and longer track record give it a bit more of a "proven" feel, while SPYI has grown quickly since it launched on 8/30/2022.
Both pay on a monthly schedule (SPYI: Monthly, JEPI: Monthly). One thing to know about JEPI: because part of its income comes from ELNs, its monthly payment can swing noticeably from month to month, depending on market volatility. Don't plan on a perfectly flat check from either fund.
What each fund pays on the same investment
This is where the yield gap becomes real money. Here is the math at today's yields.
| Investment math | SPYI | JEPI |
|---|---|---|
| Yearly income on $10,000 | $1,221 | $800 |
| Yearly income on $100,000 | $12,210 | $8,000 |
| Monthly income on $100,000 | $1,018 | $667 |
| Needed for $1,000 a month | $98,280 | $150,000 |
So to target $1,000 a month, you would need roughly $98,280 in SPYI or $150,000 in JEPI at today's yields. That is a big difference in required capital. If you want the JEPI side in more detail, I walked through it in How Much Do You Need in JEPI to Make $1,000 a Month?
One caution: these are today's yields applied forward. Option income depends on market conditions, and yields can and do change. It is a snapshot, not a promise.
Total return and price decay: the reality check
A high yield means nothing if the share price keeps sliding and eats your payouts. That is why I always look at total return, which combines price change and the income you collect.
Since inception, JEPI shows a total return of 98.0% and SPYI shows 77.0%. Before you call a winner, remember the dates. JEPI launched on 5/20/2020 and SPYI on 8/30/2022. JEPI has had more time to compound, and it also covers a different stretch of market conditions. So this is a reference point, not a verdict.
On the decay front, our data flags SPYI as price decay: No, and JEPI as price decay: No. That is a good sign for both. But it is a snapshot, and covered call funds can still lag a rising market by a wide margin.
For perspective, look at a plain index fund. VOO shows a total return of 823% since 9/7/2010, with a yield of just 1.1%. That is a much longer window, so the numbers are not comparable. But the lesson holds: high-income funds trade upside for cash flow. I go deeper on that trade-off in The Yield Trap.
Risks you should know about
- Capped upside. When the market surges, both funds will usually trail a plain S&P 500 fund.
- Downside is still real. Selling options only gives a modest cushion. If stocks drop hard, both funds can fall with them.
- Variable payouts. Monthly distributions move with volatility and market levels. Do not treat either yield as a fixed rate.
- Tax treatment varies. Distributions can be a mix of ordinary income and other types. The right account (taxable, IRA, Roth) matters, so run your own numbers.
- Active management. Both funds rely on the manager's choices. Results depend on those decisions, not just an index rule.
Which one fits which investor
SPYI tends to fit if
You want the highest cash flow of the two, you are comfortable paying a higher fee for it, and you hold it in a taxable account where its option structure may help on taxes. It also suits people who want clear S&P 500 style stock exposure while still collecting a big monthly check.
JEPI tends to fit if
You prefer a lower expense ratio, a larger fund with a longer record, and a more defensive stock basket. It is often a pick for people who want steady-ish income with a bit less volatility, and who are fine with a lower yield in exchange.
Neither may fit if
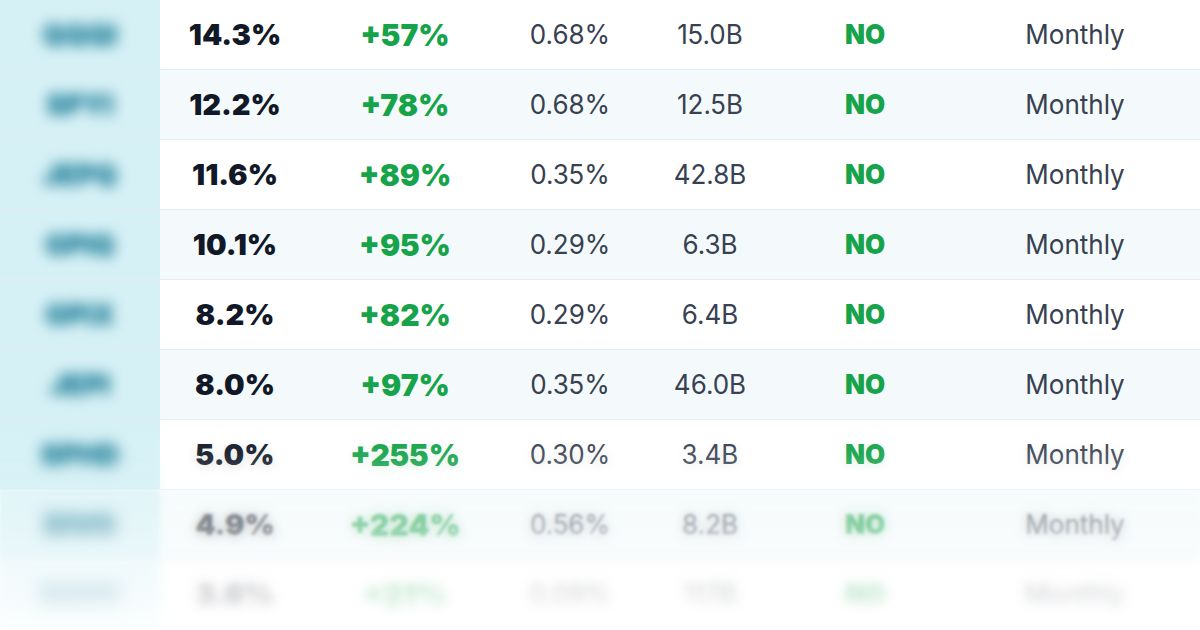
You are still in the growth phase and don't need the income yet. In that case, a low-cost fund like VOO or a dividend growth fund may line up better. If you want to compare against traditional dividend payers, look at SCHD (yield 3.2%, fee 0.06%), or at cash-like SGOV (yield 3.6%) if safety comes first. And if you like the covered call idea with Nasdaq exposure, JEPQ yields 11.6% with the same 0.35% fee as JEPI.
You can also split the difference and hold both. Plenty of income investors do that to spread out strategy and structure risk. That is a choice, not a recommendation.
SPYI vs JEPI income on your investment
Estimated annual income at each fund's current yield
Today's income only. Yields change and are not guaranteed.
Want to screen more options like these? The full list lives at TopDividendETFsPRO, and you can model future payouts with Dividend Projection.
FAQ
Is SPYI better than JEPI?
It depends on what you want. SPYI yields 12.2% versus 8.0% for JEPI, but it charges 0.68% compared with 0.35%. Higher income and lower fees point in different directions.
Do SPYI and JEPI pay monthly?
Yes. SPYI pays Monthly and JEPI pays Monthly. The amount can change from month to month.
Which has the higher total return, SPYI or JEPI?
JEPI shows 98.0% since inception and SPYI shows 77.0%. JEPI launched on 5/20/2020 and SPYI on 8/30/2022, so JEPI has had more time.
Do SPYI or JEPI have price decay?
Our data currently shows price decay: No for SPYI and No for JEPI. That can change, so keep checking total return, not just yield.
How much would I need to make $1,000 a month from SPYI?
At today's yield, about $98,280. For JEPI it would be about $150,000. Yields move, so treat these as estimates.
My bottom line on SPYI vs JEPI
SPYI is the bigger payer, JEPI is the cheaper and larger fund with the longer track record. Neither is a free lunch. Both give up some upside in exchange for monthly cash, and both can drop if the market does.
Before you choose, decide what the money is for. If you need the most income per dollar, SPYI's yield stands out. If you want lower costs and a more defensive feel, JEPI is the one to study. Either way, check total return and not only the headline yield. This isn't a buy or sell signal, so do your own due diligence and use the tools at our calculators page to run your own numbers.
ETFs in this story
How this article was made: Benjie picks every topic based on what he finds useful as a dividend investor and what readers ask about. Parts of this article were drafted with help from AI tools, then edited, fact-checked and shaped by Benjie. All fund numbers come from the TopETFs database and update daily.
Disclaimer: TopETFs.com is published by Dividend Empire LLC for educational and entertainment purposes only. We are not financial advisors, and nothing on this site is financial advice, a recommendation, or a solicitation to buy or sell any security. ETF data is compiled from public sources and fund issuers, may be delayed, inaccurate or outdated, and may differ from the fund sponsor's own figures. Yields are trailing distribution yields, are not guaranteed, and distributions may include return of capital, which reduces your cost basis and is not a measure of performance. Total returns are since each fund's inception unless noted and are not comparable across funds with different start dates. Past performance does not guarantee future results. Investing carries risk, including loss of principal. Read each fund's prospectus and consult a licensed financial advisor before investing. Dividend Empire LLC receives compensation from ETF issuers for sponsored placements, which are labeled as such.