0DTE Covered Call ETFs, Explained: How QDTE and XDTE Pay Weekly
0DTE covered call ETFs like QDTE and XDTE pay weekly. See live yields, weekly income on $10,000, price decay flags and the risks behind the payout.
The short version
- 0DTE covered call ETFs sell options that expire the same day, then pass the premium to you as a weekly payout. QDTE yields 27.6% and XDTE yields 12.4% right now.
- On $10,000, QDTE's current yield works out to about $53 a week, and XDTE's to about $24 a week.
- Both funds carry a price decay flag of Yes in our data. The yield is real, but you have to check total return before trusting it.
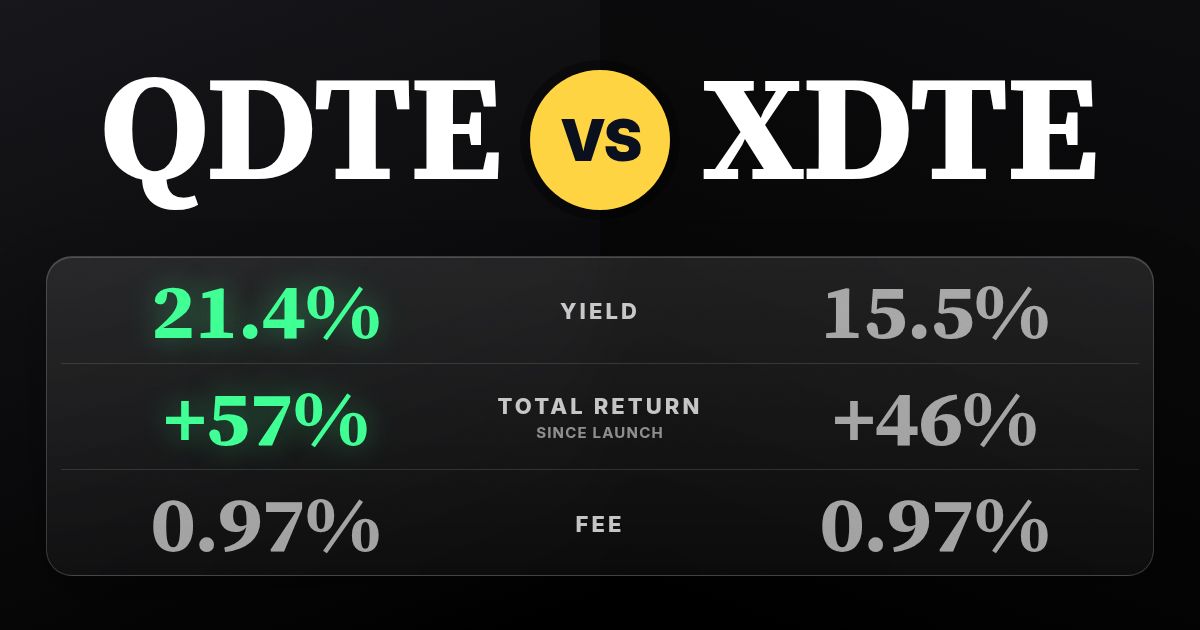
0DTE covered call ETFs are funds that hold exposure to an index and sell call options that expire in zero days, meaning the same trading day. That constant option selling is what funds the weekly distribution. QDTE (Nasdaq-100 style, yield 27.6%) and XDTE (S&P 500, yield 12.4%) are the best known examples, and both charge 0.97% a year.
0DTE covered call ETFs vs other weekly payers
What "0DTE" actually means
A call option gives the buyer the right to buy something at a set price before a set date. "0DTE" stands for zero days to expiration. The option is sold in the morning and expires by the close, so there is no waiting around for time to pass.
Why would a fund do that? Because options lose value quickly as expiration gets close. A seller who keeps selling very short-term options collects premium over and over. That premium is the cash that gets turned into your distribution.
Traditional covered call funds usually sell options that expire in a month or so. 0DTE funds compress that cycle into days, and they reset it again and again. More cycles means more premium collected, but also more chances for the strategy to give up upside.
How QDTE, XDTE and RDTE produce the weekly payout
These three funds come from Roundhill, and they share the same basic recipe with a different index on top. In plain English, the fund holds exposure to an index, sells same-day call options against it, and distributes the premium it collects after expenses.
- QDTE is tied to a large-cap, tech-heavy index (Roundhill calls it the Innovation-100). Yield: 27.6%.
- XDTE is tied to the S&P 500. Yield: 12.4%.
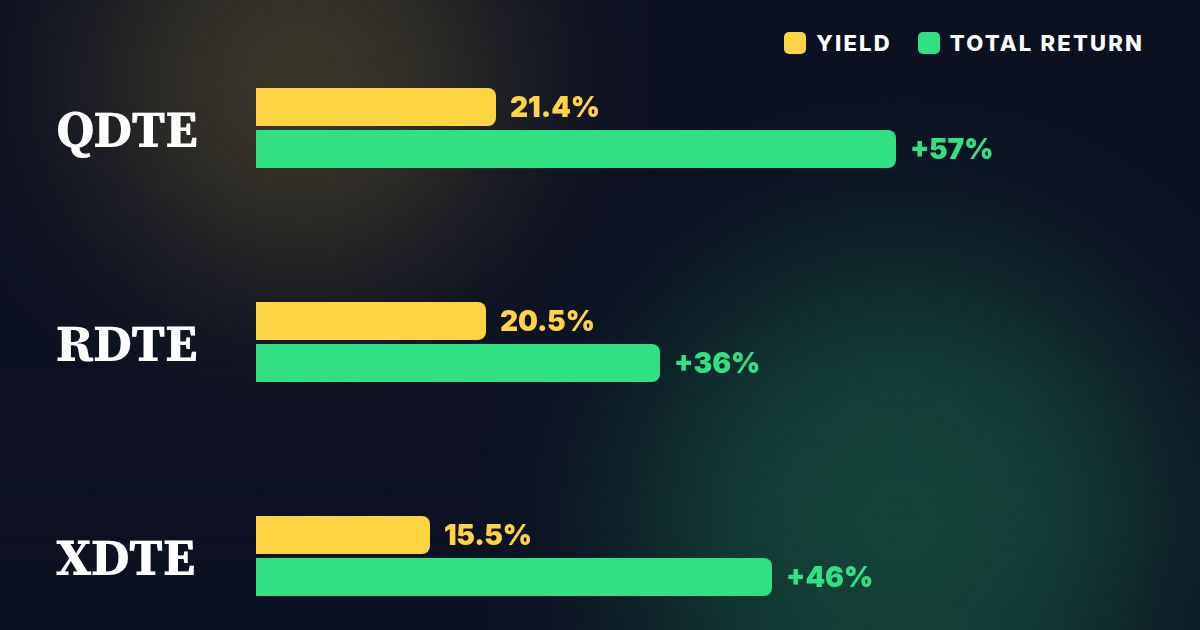
- RDTE is tied to the Russell 2000, the small-cap index. Yield: 15.7%.
All three pay Weekly. The yield gap makes sense once you know where the premium comes from. Option premium tends to be bigger when the underlying moves around more, so the tech-heavy and small-cap versions usually offer more than the S&P 500 version. For a deeper side by side, I wrote a full breakdown in QDTE vs XDTE.
The weekly income math
Let's turn the yields into dollars. These are today's numbers, not a forecast, because weekly payouts move around.
On $10,000 at current yields:
- QDTE: about $53 per week, $230 per month, $2,760 per year.
- XDTE: about $24 per week, $103 per month, $1,240 per year.
- RDTE: about $30 per week, $131 per month, $1,570 per year.
Scale it up and the picture is clearer. On $100,000, QDTE's current yield implies roughly $2,300 a month. XDTE implies roughly $1,033 a month.
Flip the question around. To target $1,000 a month, you would need about $43,478 in QDTE or about $96,774 in XDTE at today's yields. That is a big difference in capital for the same income, and it says a lot about what each fund is giving up to get there.
One thing to keep in mind: these figures assume the yield holds. Weekly distributions are not fixed like a bond coupon. They can be larger in a choppy week and smaller in a quiet one.
Total return and price decay: the part that matters most
Here's the thing about big yields. A yield only tells you what a fund paid out relative to its price. It does not tell you whether the price held up while it was paying.
Total return counts both the distributions you received and the change in the share price. Since inception, QDTE shows a total return of 55.0%, XDTE shows 45.0%, and RDTE shows 38.0%. QDTE and XDTE both launched on 3/7/2024, so those two are a fair comparison. RDTE started on 9/10/2024, so it has had less time and a different market backdrop.
All three carry a price decay flag of Yes in our data. That means the share price has trended down over the fund's life. This isn't automatically a disaster, since the payouts can more than make up for it, but it does mean part of what you receive is not pure profit.
NAV erosion and return of capital, in one paragraph
NAV is the net asset value, basically what each share is worth underneath. When a fund pays out more than its strategy earns on a net basis, some of the payout can effectively come from the fund's own assets. That is called return of capital, and it can pull NAV down over time. Whether a given distribution is classified that way is something the fund reports after the year ends, so check the fund's own tax documents instead of assuming.
Why a 0DTE strategy caps your upside
When you sell a call, you agree to give up gains above the strike price. Do that every single day and you are repeatedly capping the upside. A strong rally can leave the fund behind the index it tracks.
The downside is a different story. The fund still holds index exposure, so when markets fall, the fund falls too. The premium only softens the blow a little. That is the classic covered call trade-off: you keep most of the downside, you give up much of the upside, and you get paid steadily for taking that deal.
With same-day options, that bargain resets every day. A sharp drop followed by a sharp rebound is especially awkward, because the fund may have sold its upside away right before the bounce. That kind of whipsaw is a real way for NAV to slip even while the checks keep arriving.
How steady are the payouts?
Weekly payers are steady in schedule, not in size. You can expect a payment every week, but the amount changes with how much premium the fund collected and how the underlying moved. Do not budget a bill around one week's payout.
A practical habit is to look at several months of distributions, not the latest print. Our weekly payout write-up for CHPY, Every CHPY Dividend Ever Paid, shows exactly how much a weekly stream can move around from one week to the next.
How QDTE and XDTE compare with other weekly payers
0DTE funds sit toward the calmer end of the weekly-pay world. They write options on broad indexes instead of a single stock, and the yields reflect that.
- FEPI yields 25.2% with a lower fee of 0.65%, and focuses on large tech and innovation names.
- NVDY yields 30.0% but is built on a single stock, NVIDIA, so its results swing with that one company.
- CHPY yields 40.0% and is a semiconductor-focused fund. Its price decay flag is No, though it launched on 4/2/2025, so it has a short track record.
- MSTY yields 60.0% and leans on MicroStrategy, which makes it a very different risk profile. See MSTY ETF: Dividend Yield, Total Return and What $10,000 Pays Today for the details.
Compare total returns carefully. NVDY shows 332% since inception, but it launched on 5/10/2023, well before QDTE and XDTE, and the single-stock exposure behind it has had a very different run. Different start dates and different underlyings mean you can't read those numbers as a clean race.
Fees also matter. At 0.97%, QDTE and XDTE are not cheap, and that cost comes out of the same premium that funds your payout. Funds such as FEPI charge 0.65%, which is noticeably less. If you want to browse more weekly names, WeeklyETFs.com lists them, and our own roundup, Best Weekly Dividend ETFs, goes through the main players.
Who 0DTE covered call funds tend to fit
These funds tend to fit people who want cash flow now and understand they are trading upside for it. Someone who values a regular weekly check, accepts that the share price may drift, and plans to judge the fund on total return, not just yield, is the typical match.
They tend to fit less well for investors who need the share price to hold or grow over a long stretch, or who want a payout that never changes. If long-term growth is the goal, a plain index fund has a different job. This isn't a buy or sell signal, just a description of the trade-offs.
Between the three, the choice often comes down to how much volatility you can live with. XDTE is tied to the S&P 500 and yields less. QDTE and RDTE reach for more yield by writing options on more volatile indexes. More yield here usually means more movement, not free money.
Risks to keep in mind
- Price decay. The flag is Yes for all three funds today.
- Capped upside. Daily call selling means you miss a lot of big rallies.
- Variable payouts. The weekly amount changes, so today's yield is not a promise.
- Short track records. QDTE and XDTE started on 3/7/2024, and RDTE on 9/10/2024. That is not much history through different market cycles.
- Fees and taxes. The 0.97% expense ratio is real, and distributions may be taxed in ways that depend on your situation.
If you want to see how a weekly stream could build up over time, DividendProjection.com lets you model it, and our tools page has more calculators. To screen every income ETF side by side, there is also TopDividendETFsPRO.
What would your money earn in 0DTE covered call ETFs?
Estimated annual income at each fund's current yield
Today's income only. Yields change and are not guaranteed.
FAQ
What are 0DTE covered call ETFs?
They are funds that hold exposure to an index and sell call options that expire the same day. The premium collected is paid out to shareholders, usually weekly.
Does QDTE pay weekly?
Yes. QDTE pays Weekly, and its current yield is 27.6%. XDTE and RDTE also pay on a weekly schedule.
How much does $10,000 in XDTE pay per week?
At today's yield of 12.4%, about $24 per week, or about $1,240 per year. The real amount changes from week to week.
Are 0DTE covered call ETFs a good investment?
It depends on your goal. They can deliver steady cash flow, but all three Roundhill funds here carry a price decay flag of Yes, so total return matters more than yield. Do your own due diligence.
QDTE vs XDTE: which is better?
QDTE yields more (27.6% vs 12.4%) but is tied to a more volatile, tech-heavy index. XDTE tracks the S&P 500 and pays less. Our full comparison goes deeper.
Is the weekly payout guaranteed?
No. The schedule is regular, but the amount depends on option premium and market moves, and it can fall or rise.
Benjie's bottom line
0DTE covered call ETFs are an interesting tool, and the weekly check feels great. At 27.6% for QDTE and 12.4% for XDTE, the income is real money. But a yield is only half the story.
Look at total return, check the price decay flag, and remember that daily call selling caps your upside. If you want to explore the wider world of weekly payers, start with what $10,000 earns in weekly-pay ETFs. Then decide whether the trade-off fits your plan. This isn't advice, just the homework I would want done before I looked at one of these myself.
ETFs in this story
How this article was made: Benjie picks every topic based on what he finds useful as a dividend investor and what readers ask about. Parts of this article were drafted with help from AI tools, then edited, fact-checked and shaped by Benjie. All fund numbers come from the TopETFs database and update daily.
Disclaimer: TopETFs.com is published by Dividend Empire LLC for educational and entertainment purposes only. We are not financial advisors, and nothing on this site is financial advice, a recommendation, or a solicitation to buy or sell any security. ETF data is compiled from public sources and fund issuers, may be delayed, inaccurate or outdated, and may differ from the fund sponsor's own figures. Yields are trailing distribution yields, are not guaranteed, and distributions may include return of capital, which reduces your cost basis and is not a measure of performance. Total returns are since each fund's inception unless noted and are not comparable across funds with different start dates. Past performance does not guarantee future results. Investing carries risk, including loss of principal. Read each fund's prospectus and consult a licensed financial advisor before investing. Dividend Empire LLC receives compensation from ETF issuers for sponsored placements, which are labeled as such.