What Is Price Decay? How to Tell If a High-Yield ETF Is Shrinking
Price decay ETF meaning in plain English: why some high-yield funds lose share price, how to spot it with live data, and what to check before you buy.

The short version
- Price decay means a fund's share price drifts lower over time. You can collect a big payout and still own something that is worth less each year.
- A decay flag is not a verdict. A fund can decay and still post a positive total return, but the gap between yield and total return tells you how much of the payout was real profit.
- Before you trust any high yield, check total return, inception date, fees and what the payout is made of. Yield alone is the least reliable number on the page.
Price decay in an ETF means the fund's share price trends down over time, so the thing you own shrinks even while it pays you. Right now QYLD yields 11.7% and our database flags price decay as Yes. JEPQ yields 11.6% and is flagged No. Two big yields, two different stories underneath.
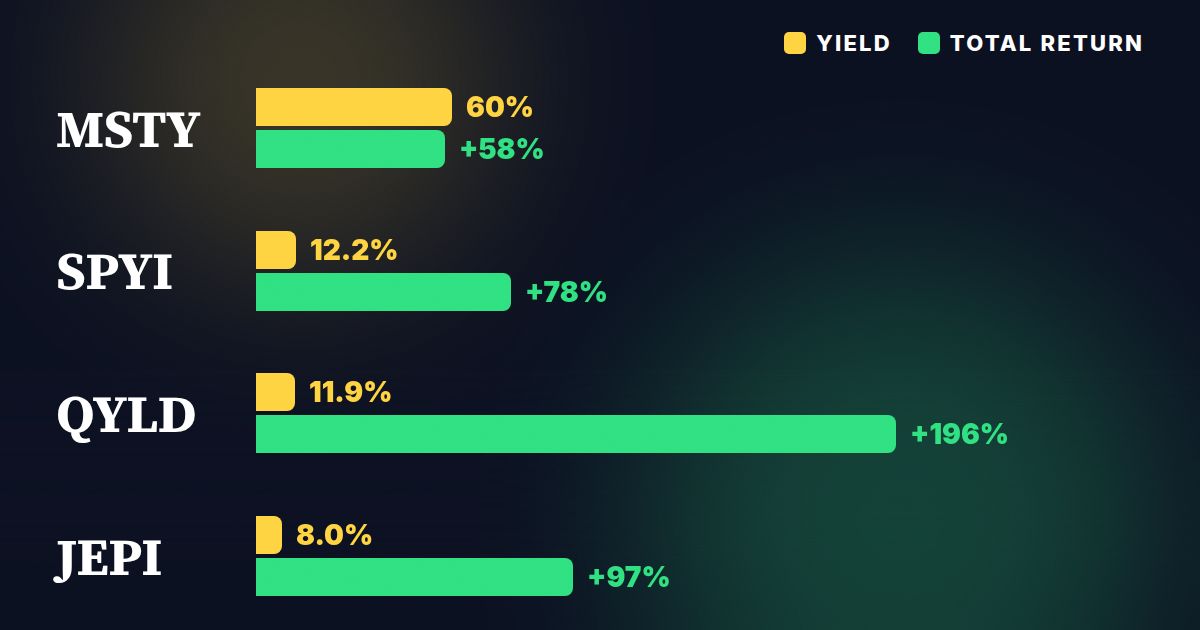
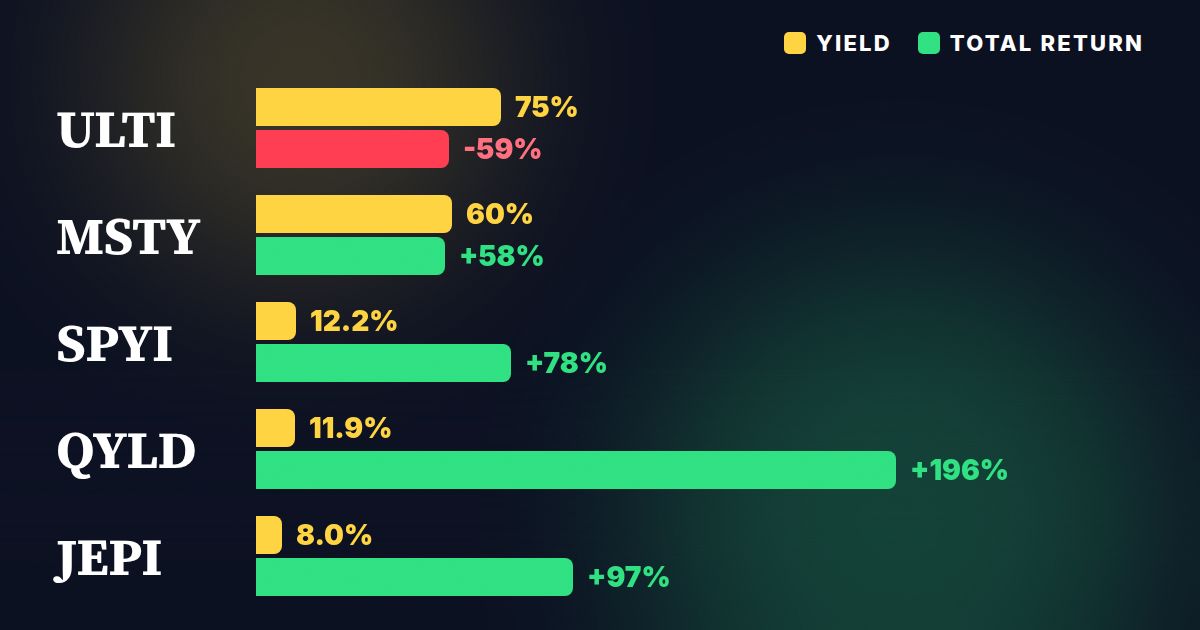
High yield vs. steady funds: yield and total return side by side
Sorted by yield, the table shows the trap. The top of the list pays the most, but yield is only half of the picture. Flip to the total return tab and the order changes. Keep that in mind as we go.
Price decay in plain English
Every ETF has a share price. That price follows the fund's NAV, or net asset value, which is simply the value of everything the fund holds divided by the number of shares. If the holdings lose value, or the fund pays out more cash than it earns, NAV goes down and so does the share price.
Price decay is when that downward drift is persistent. Not one bad month. A slow slide over years.
Here's the part beginners miss. Your real result is total return: the change in share price plus all the payouts you received. A fund can pay you generously and still leave you behind if the price falls faster than the payouts add up.
Where price decay actually comes from
It is not magic and it is not always a scam. There are a few common causes.
- Capped upside. A covered call fund sells call options (contracts that give someone else the right to buy at a set price) and keeps the premium as income. In exchange, it gives up big rallies. When markets fall, it still takes the full loss. Over time that lopsided deal can pull the share price down. I break the mechanics down in Covered Call ETFs, Explained.
- Paying out more than the fund earns. If the payout is larger than dividends plus option income, the difference comes out of the fund's own assets. Some of that can be classified as return of capital, which means the fund is handing your own money back. More on that in What Is Return of Capital in an ETF?
- A wild underlying stock. Funds like MSTY build income from options tied to a single, very volatile stock. The option premiums are rich, but so are the swings in the share price.
- Fees. Every year the expense ratio (the annual fee, taken out of the fund automatically) chips away at returns. QYLD charges 0.60% and MSTY charges 0.99%. Compare that with VOO at 0.03%. See the expense ratio math for how that gap compounds.
A worked example, step by step
Let's use made-up numbers so the logic is clear. This is a hypothetical fund, not a real one.
- You invest $10,000. The share price is $100, so you own 100 shares.
- The fund yields 12%. That is $1,200 of income over the year, roughly $100 a month.
- The share price falls to $88. Your 100 shares are now worth $8,800.
- Add it up. $8,800 in value plus $1,200 in payouts equals $10,000. Your total return is zero.
You received $1,200 in cash and it felt like income. But you ended the year exactly where you started, minus the effect of inflation. The 12% yield was real money in your account, yet none of it was profit.
Now the second-year problem. Many of these funds set payouts from option premiums and the current share price. If the price is lower, the same yield percentage produces fewer dollars. Your income can shrink right along with the price. That is why decay matters even if you only care about cash flow.
What the real funds show
Here is the same idea with real tickers. The decay flag in our database tells you whether the fund's price has been trending down. Total return is since each fund's inception, so remember the launch dates differ.
| Fund | Yield | Price decay | Total return | Inception |
|---|---|---|---|---|
| QYLD | 11.7% | Yes | 194% | 12/12/2013 |
| XYLD | 8.9% | Yes | 104% | 6/24/2013 |
| MSTY | 60.0% | Yes | 44.0% | 2/22/2024 |
| JEPI | 8.0% | No | 98.0% | 5/20/2020 |
| JEPQ | 11.6% | No | 86.0% | 5/3/2022 |
| SCHD | 3.2% | No | 590% | 10/20/2011 |
| VOO | 1.1% | No | 823% | 9/7/2010 |
A few things stand out to me.
QYLD and XYLD. Both are flagged Yes for price decay, yet both have positive total returns since launch: 194% for QYLD and 104% for XYLD. So the payouts more than made up for the shrinking share price. That is the honest picture. Decay is not the same as losing money. But compare those figures with VOO at 823% since its own launch. The high yield was not free, and the cost was the growth you gave up. (Different start dates, so this is a rough comparison, not a race.)
MSTY. A 60.0% yield is eye-catching, and the flag is Yes. Total return since inception is 44.0% over a short history that began 2/22/2024. A short track record means we know little about how it behaves across a full market cycle.
JEPI and JEPQ. Both are flagged No for decay right now, and both are also newer funds. JEPQ started 5/3/2022, so it has had fewer years in which to decay or not. A clean flag on a young fund is encouraging, not proof.
SCHD. At 3.2%, it pays far less, but the price has not been shrinking and total return is 590% since 10/20/2011. A smaller payout from a growing fund can beat a bigger payout from a shrinking one.
The income math, and why it can mislead
Here is what $10,000 pays in a year at today's yields:
Now flip it. To target $1,000 a month ($12,000 a year), you would need roughly $102,564 in QYLD, or about $375,000 in SCHD at current yields.
That gap is exactly why people chase high yield. But those dollar figures assume the yield and the share price both hold. If the price decays, the principal behind that income shrinks, and the income can follow. Today's yield is a snapshot, not a promise. If you want to model it forward, Dividend Projection lets you project future income instead of trusting one number.
What your money pays: high yield vs. steady funds
Estimated annual income at each fund's current yield
Today's income only. Yields change and are not guaranteed.
Is price decay always bad?
No, and I want to be fair here. Some investors want current cash flow and accept that the share price may drift. If total return is still positive and the payouts cover their bills, that can be a rational trade.
It gets bad when you do not know it is happening. The danger is the investor who sees a big yield, spends every payout, and never checks whether the account value is falling. Years later, the income is smaller and so is the principal.
Decay also looks different in different markets. In a strong rally, a covered call fund lags badly because of its capped upside. In a sell-off, it falls with the market and keeps only a small cushion from option income. Neither case is a defect, it is just how the strategy is built. I go deeper on this trade-off in The Yield Trap.
Common mistakes beginners make
- Judging by yield alone. The yield is the payout divided by the current price. If the price falls, the yield can go up, which makes a failing fund look better.
- Ignoring the start date. Total return since inception depends on when the fund launched. A fund that started during a downturn or a rally is not a fair match for one that started at a different time.
- Treating every payout as profit. Part of a distribution can be return of capital, which is your own money coming back to you.
- Reading one flag as the whole story. A decay flag of Yes or No is a starting point. Look at total return, fees and history too.
- Spending everything and skipping reinvestment. Reinvesting some of the payouts can offset decay, while spending all of it makes the shrinkage permanent.
What to check before buying any ETF
- Total return, not just yield. Compare the two. A huge gap between a high yield and a low total return is a warning.
- The price decay flag. Is the share price trending down? Then ask how long the fund has existed.
- Inception date. Short histories hide a lot. Be careful with anything that has not been through a full bear market.
- Expense ratio. Fees show up every year whether the fund does well or not.
- Source of the payout. Dividends, option premiums and return of capital are not the same thing.
- Fit with your goal. Cash flow now, growth later, or a mix? A fund that fits one goal can badly miss another.
You can screen income funds on these exact points at TopDividendETFsPRO, and if you want to see weekly payers specifically, WeeklyETFs lists them. Monthly payers are ranked in Best Monthly Dividend ETFs.
FAQ
What does price decay mean in an ETF?
It means the fund's share price trends lower over time. The fund can still pay you income, but the value of your shares shrinks, which eats into your total return.
Does price decay mean I will lose money?
Not necessarily. Total return counts both price changes and payouts. A fund can decay and still be up overall, as the 194% total return for QYLD since inception shows. It just means the payouts are doing more of the work.
Is QYLD's price decay a problem?
Our data flags QYLD price decay as Yes. Whether that is a problem depends on your goal. If you want steady cash and accept a shrinking share price, it may fit. If you want growth, funds like SCHG or VOO have a different profile.
How can I tell if a high-yield ETF is shrinking?
Compare yield with total return since inception, check the decay flag, and look at the share price chart over several years. A big yield with weak total return and a falling price is the classic sign.
Do covered call ETFs always have price decay?
No. JEPI is flagged No for decay and JEPQ is flagged No, though both are younger funds with shorter histories. Structure matters, and so does time.
My bottom line
Price decay is the hidden cost behind a lot of big yields. A 60.0% or 11.7% payout looks great until you check what happened to the share price underneath. That is why I always put total return next to yield before I think a fund is interesting.
Decay is not automatically a deal breaker, and a low yield is not automatically safe. The job is to know which one you are looking at and whether it matches what you want the money to do. This isn't a buy or sell signal, so do your own due diligence.
ETFs in this story
How this article was made: Benjie picks every topic based on what he finds useful as a dividend investor and what readers ask about. Parts of this article were drafted with help from AI tools, then edited, fact-checked and shaped by Benjie. All fund numbers come from the TopETFs database and update daily.
Disclaimer: TopETFs.com is published by Dividend Empire LLC for educational and entertainment purposes only. We are not financial advisors, and nothing on this site is financial advice, a recommendation, or a solicitation to buy or sell any security. ETF data is compiled from public sources and fund issuers, may be delayed, inaccurate or outdated, and may differ from the fund sponsor's own figures. Yields are trailing distribution yields, are not guaranteed, and distributions may include return of capital, which reduces your cost basis and is not a measure of performance. Total returns are since each fund's inception unless noted and are not comparable across funds with different start dates. Past performance does not guarantee future results. Investing carries risk, including loss of principal. Read each fund's prospectus and consult a licensed financial advisor before investing. Dividend Empire LLC receives compensation from ETF issuers for sponsored placements, which are labeled as such.