QDTE ETF: Dividend Yield, Total Return and What $10,000 Pays Today
QDTE ETF explained in plain English: how its weekly 0DTE covered call income works, live yield, total return, price decay risk and who it fits.
The short version
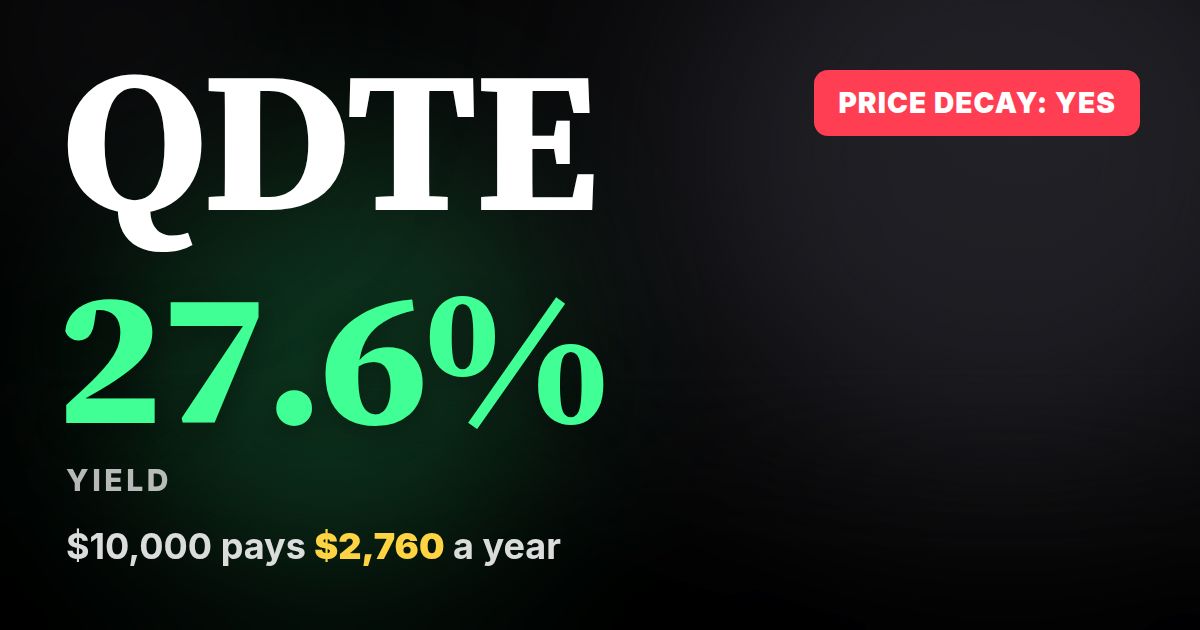
- QDTE yields 27.6% today and pays Weekly, which works out to about $53.08 a week on $10,000.
- The income comes from selling same-day call options on a Nasdaq-style portfolio, which caps your upside. The price decay flag in our data reads Yes.
- Total return since inception is 55.0%, but the fund only launched on 3/7/2024, so it is a short track record.
QDTE is Roundhill's weekly-pay covered call ETF built on Nasdaq-style tech exposure. It currently yields 27.6%, charges 0.97% a year, manages $916M and has returned 55.0% since it launched. On $10,000, today's yield implies roughly $2,760 a year, but that number is not a promise.
QDTE vs other weekly payers
What QDTE is and who runs it
QDTE is the Roundhill Innovation-100 0DTE Covered Call Strategy ETF. Roundhill is the issuer, the same firm behind a family of weekly-pay options funds. The fund launched on 3/7/2024 alongside its sibling XDTE, which does the same job on the S&P 500.
The pitch is simple. You get exposure to large Nasdaq-style growth names, and instead of waiting for a quarterly dividend, the fund sells options to generate cash it passes out every week. It sits on our weekly-pay and income screens for exactly that reason.
If you want the bigger picture on this style of fund, I walked through the mechanics in 0DTE Covered Call ETFs, Explained.
How QDTE produces its weekly payout
First, a quick definition. A covered call means you own an asset and sell someone the right to buy it at a set price. You collect a payment (the premium) up front. In exchange, you give up gains above that price.
"0DTE" stands for zero days to expiration. The options QDTE sells expire the same day they are sold, so the fund is constantly rolling short-dated trades. Each day brings a fresh premium, and those premiums add up into the weekly distribution.
Here is the part that matters. The payout is not a stock dividend. Tech companies in the Nasdaq-style basket pay little or nothing. The money comes mostly from option premium, and that is why the yield is so much higher than a normal dividend fund.
The trade-off is built in. When the market rips higher in a single day, the call options cap what the fund keeps. When the market drops, you still take the full downside on the underlying exposure, with only the premium as a small cushion. Over time that asymmetry is what can wear down the share price.
The live numbers on QDTE
- Yield: 27.6%
- Expense ratio: 0.97%
- Assets under management: $916M
- Total return since inception: 55.0%
- Payout frequency: Weekly
- Price decay flag: Yes
The fee deserves a comment. At 0.97%, QDTE costs far more than a plain index fund. That is normal for active options strategies, but it comes straight out of your return every year. Assets of $916M tell me plenty of investors are using it, which helps with trading liquidity.
What $10,000 and $100,000 pay in QDTE
Let's turn the yield into real dollars. These are based on today's yield only. Distributions change from week to week, so treat this as a snapshot.
- $10,000 per week: about $53.08
- $10,000 per month: about $230.00
- $10,000 per year: about $2,760
- $100,000 per month: about $2,300
- $100,000 per year: about $27,600
Flip it around. To target $1,000 a month at today's yield, you would need roughly $43,478 invested. That is the math on paper. In real life the weekly amount moves, and your share price moves too, so that income stream can shrink if the fund's price slides.
If you want to model your own amount, our calculators and Dividend Projection help you project income over time.
Total return and price decay: the honest check
A big yield means nothing if the share price melts. That is why I look at total return, which adds distributions to price change. QDTE shows 55.0% since inception.
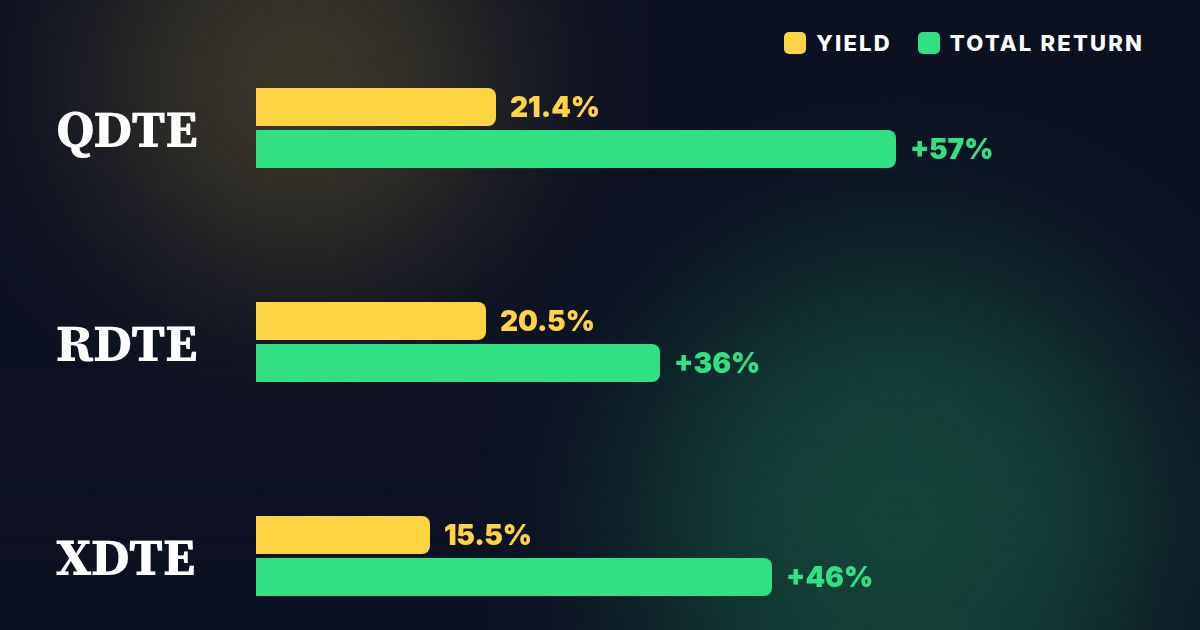
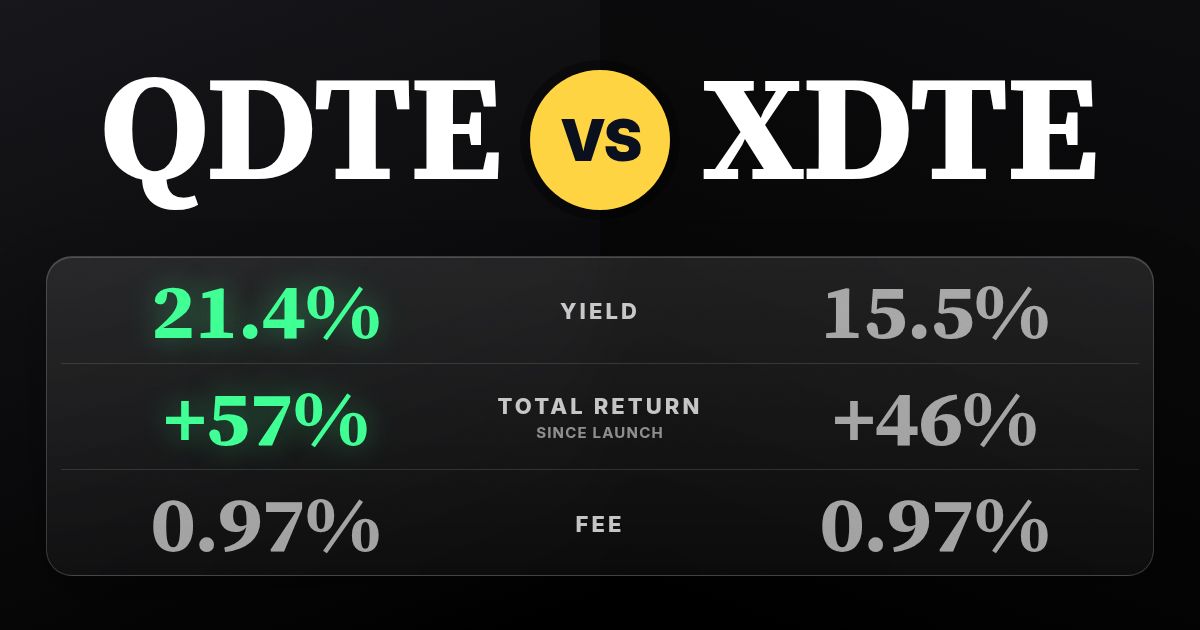
One caveat before anyone gets excited: total return in our data runs from each fund's own launch date. QDTE started on 3/7/2024, so it has a relatively short history and has not been tested through a long bear market. Sibling XDTE launched the same day and shows 45.0%, with a much lower yield of 12.4%.
Our data flags QDTE's price decay as Yes. That means the share price has trended lower over its life, even as the distributions kept arriving. A positive total return with decay means the payouts have so far outrun the price erosion. It does not mean the erosion is not happening.
This is where return of capital comes in. Return of capital means part of a distribution is classified as your own money handed back rather than earnings. Option funds sometimes pay out more than their strategy actually earned in a period, and that can show up as NAV erosion. NAV is the net asset value, or the fund's per-share worth. When NAV keeps falling, future premiums are earned on a smaller base. That is the slow leak to watch.
How steady are the weekly payouts?
The payout is frequent, but it is not fixed. Because it depends on option premium, the amount can swing with market volatility. Active, choppy markets tend to help premiums. Quiet, grinding rallies can shrink them while the cap on upside still bites.
Do not assume last week's check will be this week's check. If you are budgeting around the income, look at a range of past payments, not just the headline yield. Yield on a screen is a trailing snapshot, and it can look different a few months later.
How QDTE compares to close alternatives
QDTE vs XDTE
Same issuer, same launch day, same fee structure idea. XDTE writes 0DTE calls on the S&P 500 and yields 12.4%. QDTE writes on a more tech-heavy basket and yields 27.6%. Higher yield here comes with more volatility underneath. I broke it down in QDTE vs XDTE.
QDTE vs FEPI
FEPI from REX is another tech-focused income fund, yielding 25.2% with a lower fee of 0.65%. Its total return is 59.0% since 10/9/2023, so it has a longer record than QDTE but the periods are not identical. Fees matter over time, and this one is noticeably cheaper.
QDTE vs NVDY
NVDY from YieldMax is a single-stock bet on NVIDIA. It yields 30.0% and shows 332% since 5/10/2023. That return is large partly because it launched earlier and caught a huge run in its underlying stock. QDTE spreads risk across a basket, while NVDY is concentrated in one name. Different risk, not a like-for-like comparison.
If you want to browse every weekly payer side by side, WeeklyETFs.com covers them, and our best weekly dividend ETFs list is a good starting point.
The main risks
- Capped upside: You will not fully participate if tech surges.
- Full downside: A sharp sell-off hurts, and premium only partly offsets it.
- NAV erosion: Price decay is flagged Yes, so the share price can drift lower over time.
- Variable income: Weekly checks move with volatility and are not guaranteed.
- Cost: A 0.97% expense ratio is a steady drag.
- Short history: The fund has only existed since 3/7/2024.
- Tax complexity: Distribution character can vary, so check with a tax professional about your situation.
Who QDTE tends to fit, and who should skip it
QDTE tends to fit investors who want frequent cash flow, understand that the payout comes from options rather than dividends, and accept that growth is capped. It can suit someone who treats part of the income as a return of their own capital and keeps an eye on the share price instead of just the yield.
It tends to be a poor fit for anyone who needs stable principal, wants to ride a tech rally to the fullest, or assumes a double-digit yield means safe income. If you are a long-term compounder who reinvests and cares most about total wealth, a plain growth fund may serve you better. If you want to see how weekly payers compare in dollars, check what $10,000 earns in weekly-pay ETFs.
Compared with the wild single-stock names like MSTY (yield 60.0%), QDTE is a more diversified approach with a lower headline yield. You can read more in the MSTY deep dive. And to screen every income ETF by fee, yield and decay, use TopDividendETFsPRO.
QDTE vs close alternatives: estimated income
Estimated annual income at each fund's current yield
Today's income only. Yields change and are not guaranteed.
FAQ
Does QDTE pay monthly or weekly?
QDTE pays Weekly. The amount changes from week to week because it depends on option premium collected.
What is QDTE's dividend yield?
QDTE's current yield is 27.6%. That is a trailing snapshot and can change as payouts and the share price move.
Is QDTE a good investment?
It depends on your goal. It offers high weekly income, but with capped upside, a 0.97% fee and a price decay flag of Yes. Do your own due diligence.
What does 0DTE mean in QDTE?
0DTE means zero days to expiration. The fund sells call options that expire the same day to generate its income.
QDTE vs XDTE: which is better?
QDTE yields 27.6% on tech-style exposure, while XDTE yields 12.4% on the S&P 500. Neither is better for everyone, it comes down to how much volatility you can handle.
How much does $10,000 in QDTE pay?
At today's yield, about $53.08 a week, or roughly $2,760 a year. Real payouts will vary.
Benjie's bottom line
QDTE is a real income machine on paper, with 27.6% paid weekly and a 55.0% total return since 3/7/2024. But the same options engine that creates the cash also caps your gains, and the decay flag reads Yes. I would watch share price and total return, not just the yield on the screen.
This isn't a buy or sell signal. It is a tool that suits some income goals and not others. Know what you own, size it carefully, and do your own due diligence.
ETFs in this story
How this article was made: Benjie picks every topic based on what he finds useful as a dividend investor and what readers ask about. Parts of this article were drafted with help from AI tools, then edited, fact-checked and shaped by Benjie. All fund numbers come from the TopETFs database and update daily.
Disclaimer: TopETFs.com is published by Dividend Empire LLC for educational and entertainment purposes only. We are not financial advisors, and nothing on this site is financial advice, a recommendation, or a solicitation to buy or sell any security. ETF data is compiled from public sources and fund issuers, may be delayed, inaccurate or outdated, and may differ from the fund sponsor's own figures. Yields are trailing distribution yields, are not guaranteed, and distributions may include return of capital, which reduces your cost basis and is not a measure of performance. Total returns are since each fund's inception unless noted and are not comparable across funds with different start dates. Past performance does not guarantee future results. Investing carries risk, including loss of principal. Read each fund's prospectus and consult a licensed financial advisor before investing. Dividend Empire LLC receives compensation from ETF issuers for sponsored placements, which are labeled as such.