SCHD vs VOO: Yield, Total Return, Fees and Which One Fits You
SCHD vs VOO head to head: live yield, fees, assets and total return since inception, plus what $10,000 and $100,000 pay and which investor each fits.
The short version
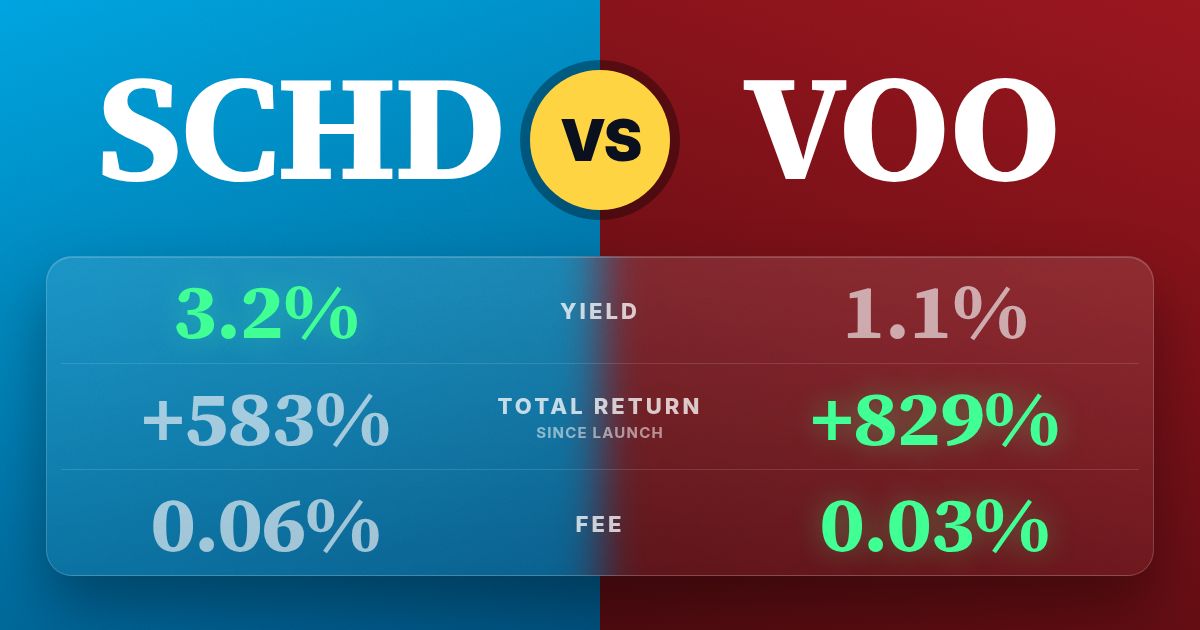
- SCHD yields 3.2% and VOO yields 1.1%. On $100,000, that is about $3,200 a year from SCHD versus about $1,100 from VOO.
- Both are very cheap, at 0.06% for SCHD and 0.03% for VOO. Neither is flagged for price decay.
- VOO shows a higher total return since inception, but it launched earlier than SCHD, so the two numbers are not a clean race.
SCHD vs VOO comes down to income now versus broad growth. SCHD pays 3.2% from a screened basket of dividend stocks. VOO pays 1.1% from the whole S&P 500 and has a total return since inception of 823%, compared with 590% for SCHD. Same quarterly payout schedule, very different jobs.
SCHD vs VOO and close alternatives
How the two funds are built
Here's the thing: these two funds are not really competitors in the way people frame them. They are two different ways to own U.S. large-cap stocks.
VOO tracks the S&P 500. It holds roughly 500 of the biggest U.S. companies, weighted by size. The largest companies get the biggest slice, so the fund leans heavily on whatever is leading the market. Dividends are a byproduct, not the goal.
SCHD tracks a dividend index that screens for companies with a record of paying dividends and solid financial quality, then holds around 100 of them. It is also weighted toward larger firms, but the screen pushes it toward value-style, cash-generating businesses and away from the pure growth names that dominate the S&P 500.
Both are plain index funds. No options, no leverage, no complicated income engine. Both pay on a Quarterly schedule, so you get four payments a year from each.
Yield: what each one pays
SCHD's current yield is 3.2%. VOO's is 1.1%. That is a big gap in cash flow, and it is the main reason income investors look at SCHD first.
Let's put it in real dollars at today's yields:
- $10,000 in SCHD: about $320 a year
- $10,000 in VOO: about $110 a year
- $100,000 in SCHD: about $3,200 a year, or roughly $267 a month averaged out
- $100,000 in VOO: about $1,100 a year, or roughly $92 a month averaged out
Remember that both funds actually pay quarterly, so the monthly figure is an average, not a deposit that lands every month. Payments also move around with company dividends, so treat these as estimates, not promises.
Flip it around and ask how much you need for $1,000 a month. At current yields, that is about $375,000 in SCHD or about $1,090,909 in VOO. That difference is the whole story for anyone living off dividends. If you want a deeper walk-through, see how much you need in SCHD to make $1,000 a month.
Total return: the number that keeps yield honest
A higher yield only matters if the fund's price holds up. That is why I always check total return, which counts price change plus dividends reinvested.
Since inception, VOO shows 823% and SCHD shows 590%. Both are strong. But the starting lines are different. VOO launched on 9/7/2010, while SCHD launched on 10/20/2011. VOO had more than a year of head start, and it was a strong stretch for U.S. stocks. Do not read that gap as a pure performance verdict.
What I can say fairly: over their lives, the broad market fund has produced a higher number than the dividend fund, while the dividend fund has delivered several times the yield along the way. You trade some growth for more cash now. Whether that trade is worth it depends on you.
On price decay, the flag for SCHD is No and for VOO it is No. That is what you would expect from plain index funds that are not paying out more than their holdings earn. Neither has the eroding-NAV problem you sometimes see in the high-yield option-income world.
Fees and size
The expense ratio is the yearly fee taken out of the fund. SCHD charges 0.06% and VOO charges 0.03%. On $100,000, that is about $60 a year for SCHD and about $30 for VOO.
VOO is cheaper, but the difference is small in dollars. I would not pick one over the other based on fees alone. If you want to see how fees add up over decades, read the expense ratio math.
On size, VOO manages $1.06T and SCHD manages $119B. VOO is one of the largest ETFs anywhere. SCHD is also huge, and one of the biggest dividend ETFs. Neither has any liquidity worry for a normal investor.
Risks to know about each
SCHD is more concentrated in certain sectors because of its dividend screen. It tends to hold fewer of the mega-cap growth companies that have powered the S&P 500, so it can lag in a market led by those names. Its dividend is also not fixed. If companies cut payouts, the income falls.
VOO carries the risk of concentration at the top. A handful of very large companies make up a big share of the fund, so its results lean on them. And the yield is low, so if you need cash flow you will be selling shares to fill the gap, which is fine in good markets and uncomfortable in bad ones.
Both funds can fall hard in a bear market. Being a dividend fund does not make SCHD immune to losses.
Which investor each one tends to fit
SCHD tends to fit people who want meaningful income today or soon, like semi-retirees or anyone building a dividend stream they can watch grow. It also suits investors who like a rules-based quality screen and are fine with giving up some upside for yield. If this is you, my piece on SCHD's yield and total return goes deeper.
VOO tends to fit long-term investors who are still working, reinvesting everything and focused on growing the portfolio. If you do not need the cash flow, the low yield is not a cost, it just means more of your return comes from price growth.
Owning both is also common. VOO as the broad core, SCHD as the income and value tilt. They overlap in some large U.S. companies, but their weightings differ enough that many people hold them together.
How they compare to other options
If you like the SCHD idea but want to compare, look at VYM at 2.3% or VIG at 1.5%. VIG focuses on dividend growth rather than high yield, so its income is lower but it has a total return of 644% since its 4/21/2006 launch. DGRO sits at 2.0%.
If you lean the other way and want growth, SCHG has a total return of 1,141% since its 12/11/2009 start, with a yield of just 0.4%. Different start date again, so compare carefully.
And if your only goal is the biggest paycheck, there are options-based funds like JEPI at 8.0%. They come with higher fees and different trade-offs, which I cover in SCHD vs JEPI. For simple cash with almost no stock risk, SGOV yields 3.6% but is not built for growth.
To screen every income ETF side by side, use TopDividendETFsPRO. For broader growth names, see GrowthETFs.com.
What the same investment pays in SCHD, VOO, VIG and VYM
Estimated annual income at each fund's current yield
Today's income only. Yields change and are not guaranteed.
Want to see how that income might grow over time? Try Dividend Projection or the TopETFs calculators.
FAQ
Is SCHD or VOO better?
Neither is better in every case. SCHD yields 3.2% and fits income needs, while VOO yields 1.1% and fits long-term growth. Your goal decides it.
Does SCHD pay more than VOO?
Yes. At today's yields, $10,000 in SCHD pays about $320 a year, compared with about $110 for VOO.
Do SCHD and VOO pay monthly?
No. Both pay on a Quarterly schedule, so you receive four payments a year from each.
Has VOO outperformed SCHD?
VOO's total return since inception is 823% versus 590% for SCHD. But VOO launched on 9/7/2010 and SCHD on 10/20/2011, so the periods are not identical.
Can I own both SCHD and VOO?
Many investors do. VOO gives broad market exposure and SCHD adds a dividend and quality tilt, though they do hold some of the same large companies.
Which has the lower fee, SCHD or VOO?
VOO charges 0.03% and SCHD charges 0.06%. Both are low enough that the dollar difference is small.
My bottom line
SCHD and VOO are both excellent, low-cost core funds, and neither shows price decay in our data. SCHD gives you more income today. VOO has the higher total return since inception, with the caveat that it started earlier. The real question is whether you need cash flow now or want to let growth do the work.
If you are still deciding where to start, my guide to dividend ETFs for beginners is a good next step. This isn't a buy or sell signal, and yields and returns will change, so do your own due diligence before you invest.
ETFs in this story
How this article was made: Benjie picks every topic based on what he finds useful as a dividend investor and what readers ask about. Parts of this article were drafted with help from AI tools, then edited, fact-checked and shaped by Benjie. All fund numbers come from the TopETFs database and update daily.
Disclaimer: TopETFs.com is published by Dividend Empire LLC for educational and entertainment purposes only. We are not financial advisors, and nothing on this site is financial advice, a recommendation, or a solicitation to buy or sell any security. ETF data is compiled from public sources and fund issuers, may be delayed, inaccurate or outdated, and may differ from the fund sponsor's own figures. Yields are trailing distribution yields, are not guaranteed, and distributions may include return of capital, which reduces your cost basis and is not a measure of performance. Total returns are since each fund's inception unless noted and are not comparable across funds with different start dates. Past performance does not guarantee future results. Investing carries risk, including loss of principal. Read each fund's prospectus and consult a licensed financial advisor before investing. Dividend Empire LLC receives compensation from ETF issuers for sponsored placements, which are labeled as such.