SCHG ETF Review: Total Return, Fees, Holdings and Who It Fits
SCHG ETF review: live total return since inception, its tiny fee, assets, top-heavy holdings and how it stacks up against VOO, QQQ and VUG.
The short version
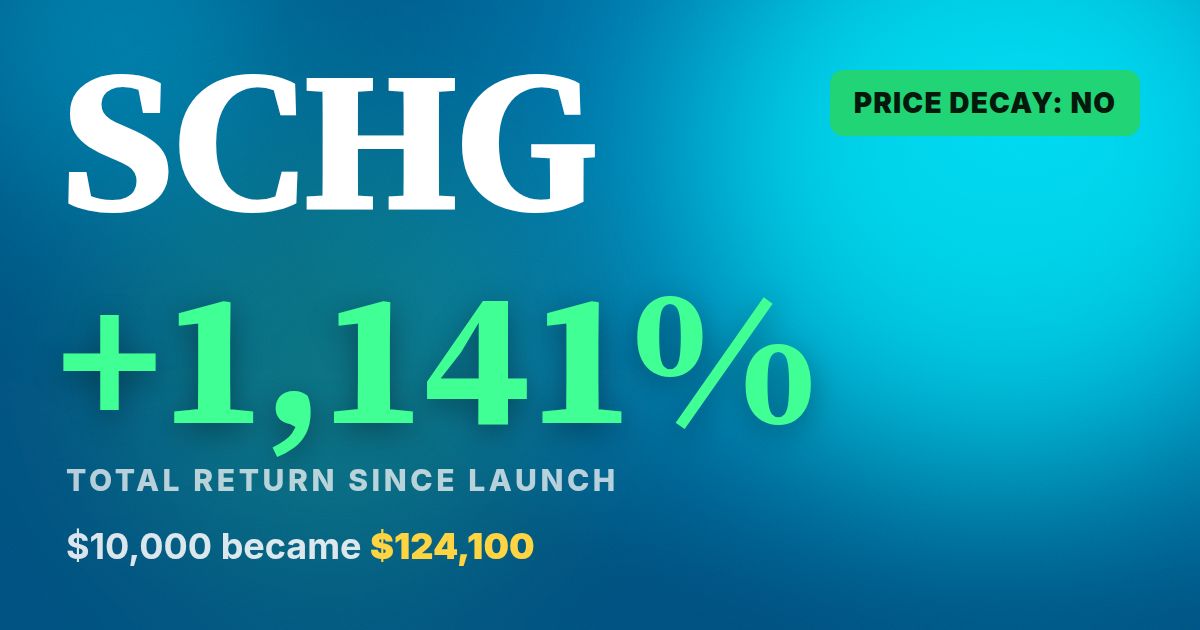
- SCHG is a low-cost fund of large U.S. growth stocks, with a total return of 1,141% since its 12/11/2009 inception and an expense ratio of just 0.04%.
- It is top-heavy. A handful of mega-cap tech and tech-adjacent names drive much of the result, which helps in good years and hurts in bad ones.
- The yield is only 0.4%, so this is a fund you own for growth, not for a paycheck.
SCHG is the Schwab U.S. Growth ETF, and it has delivered a total return of 1,141% since inception while charging 0.04% a year and managing $63.8B in assets. That works out to roughly $124,100 from a $10,000 start. Here is what it holds, how it compares to its closest rivals, and who it actually fits.
SCHG vs close growth alternatives
What SCHG is and who runs it
SCHG is run by Schwab Asset Management, the fund arm of Charles Schwab. It is an index fund, which means there is no manager picking stocks. The fund simply follows a Dow Jones index of large U.S. companies that screen as growth stocks.
Schwab built its ETF lineup around one idea: make the fees as close to zero as possible. SCHG is a good example. It pays out on a Quarterly schedule, and it carries no price decay flag in our data (No), which is what you would expect from a plain index fund with no options or leverage.
What SCHG holds
The fund is a large-cap growth portfolio. It leans toward companies with faster earnings and revenue growth and higher valuations, and it skips most of the slower, cheaper parts of the market like banks, utilities and old-line industrials.
In practice, that means a big tilt toward technology and communication services, with a good helping of consumer discretionary and health care. The biggest positions are the names you already know: the large U.S. tech platforms, the major chipmakers, the e-commerce giants and the big social media and search companies. The exact weights move around every quarter, so check Schwab's site for the current list.
Here's the thing about concentration. Growth indexes are usually weighted by company size, so the largest companies get the biggest slice. A small group of mega-caps can make up a large share of the whole fund. You may own a few hundred stocks on paper, but the top handful does most of the work. That is not a flaw, but you should know it going in.
How SCHG has done since inception
SCHG has a total return of 1,141% since 12/11/2009. A $10,000 investment at the start would now be about $124,100, with dividends reinvested. That is a strong run, and it came through a long stretch where large U.S. growth stocks, especially tech, were the best place to be.
Two cautions. First, that number is a look back at a very friendly period for growth. It is not a forecast. Second, growth funds do not go up in a straight line. They took a hard hit in 2022 when interest rates rose and high valuations got repriced. Anyone who bought at the top of a run had to sit through that.
The other thing to watch is the starting date. Every fund in our data has its own inception date, so the total return figures are not apples to apples. A fund that launched before a big rally will look better than one that launched after it.
Fees: where SCHG really shines
The expense ratio is the yearly fee taken out of the fund, expressed as a percent of your money. SCHG charges 0.04%. On $10,000 invested, that is $4 a year. On $100,000 it is $40 a year.
For comparison, VOO charges 0.03%. The gap between the two is tiny. At these levels, fees are not the deciding factor. What you hold matters far more than a rounding error in the expense ratio.
The small yield: a side note
SCHG yields 0.4%. That is what growth companies tend to pay, because they would rather reinvest profits in the business than hand them out. For reference, VOO yields 1.1%, a bit more because the S&P 500 includes slower, more mature payers.
The income math is simple and sobering. $10,000 in SCHG throws off about $40 a year. $100,000 pays about $100 per quarter. If you wanted $1,000 a month from SCHG dividends alone, you would need around $3,000,000 invested. That is why I treat SCHG as a growth holding and not an income one.
Reality check: how little income a growth fund throws off
Estimated annual income at each fund's current yield
Today's income only. Yields change and are not guaranteed.
SCHG vs the close alternatives
Several funds cover the same ground, and the differences come down to index rules.
SCHG vs VUG and VONG
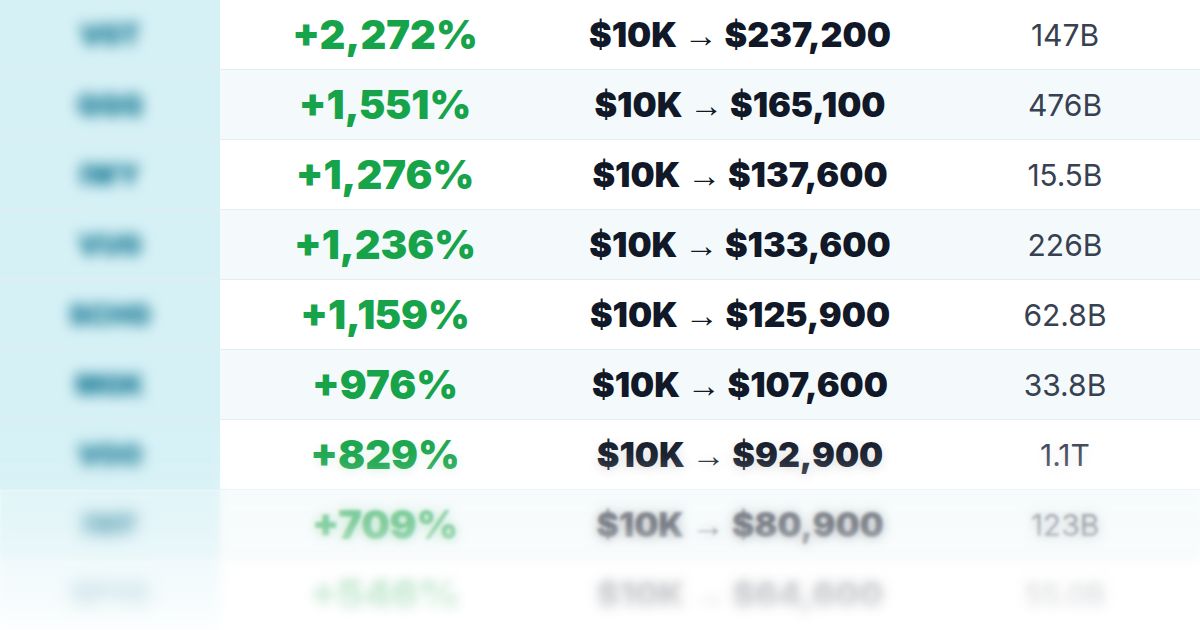
VUG (Vanguard Growth) and VONG (Vanguard Russell 1000 Growth) are the nearest cousins. VUG shows a total return of 1,211% and $230B in assets. VONG shows 1,019% and $46.5B. SCHG sits at 1,141% with $63.8B. All three are low-cost large-cap growth funds, and the gaps in return partly reflect different launch dates and slightly different index rules.
SCHG vs QQQ
QQQ tracks the Nasdaq-100, the biggest non-financial companies on the Nasdaq. It is not a growth screen, but it ends up with a similar tech-heavy feel. Its total return in our data is 1,519% on $487B in assets. I covered this one in detail in SCHG vs QQQ, and you can read the fund on its own in the QQQ ETF review.
SCHG vs VOO
VOO is the plain S&P 500, a blend of growth and value. It shows a total return of 823% since its 9/7/2010 inception, with $1.06T in assets. It is less tilted toward growth, so it is usually the calmer ride. My VOO ETF review goes deeper, and VOO vs QQQ shows the same trade-off from another angle.
Other growth peers
IWF shows 695%, IVW shows 819%, and SPYG shows 536%. The S&P 500 growth versions (IVW and SPYG) pick from a narrower pool than Russell or Dow Jones growth indexes, and that can change the mix. Remember, these are since-inception figures from different start dates, so do not read them as a clean race. For a broader ranking, see the best growth ETFs.
The main risks
- Concentration. A few giant companies drive a large share of results. If they stumble, the whole fund feels it.
- Valuation risk. Growth stocks are priced for strong future earnings. When rates rise or growth slows, prices can fall fast.
- Overlap. If you also own VOO, QQQ or a total market fund, you already hold many of the same top names. Adding SCHG can double up your tech exposure without you noticing.
- Recency bias. The great track record came in a period when large growth beat almost everything. That may or may not repeat.
Also, do not confuse this with leveraged funds. SCHG is a plain index fund. A fund like TQQQ is a different animal, and I explain why in leveraged ETF decay.
Who SCHG tends to fit, and who might skip it
SCHG tends to fit long-term investors who want a cheap, simple way to tilt toward large U.S. growth and who will not panic when the fund drops hard. It also works for people who already own a broad index fund and want a deliberate growth sleeve on top.
It tends to fit poorly for anyone who needs income now, since the yield is 0.4%. It is also a tough fit if you cannot stomach big drawdowns, or if you already hold a lot of tech through other funds. For those readers, a broad fund like VOO or an income-focused fund may match the goal better. If you want to see how future dividends could stack up, try Dividend Projection or the TopETFs calculators.
FAQ
What does SCHG invest in?
SCHG holds large U.S. growth stocks that make up a Dow Jones large-cap growth index. It is heavy in technology and communication services, with the biggest weights in a handful of mega-cap names.
Does SCHG pay dividends?
Yes. It pays Quarterly at a current yield of 0.4%. That is small, because growth companies tend to reinvest rather than distribute profits.
What is the SCHG expense ratio?
It is 0.04%, which comes to $4 per year on a $10,000 investment.
Is SCHG a good investment?
It has a total return of 1,141% since inception with very low fees, but it is concentrated and can fall sharply. Whether it fits depends on your goals and time horizon. This isn't a buy or sell signal.
SCHG vs VOO: which is better?
SCHG leans into growth and has a total return of 1,141% versus 823% for VOO, but they launched on different dates. VOO is a broader blend and usually less top-heavy in growth names.
Benjie's bottom line
SCHG is about as clean as a growth fund gets: a 0.04% fee, $63.8B in assets and a 1,141% total return since inception. The cost is concentration and a rough ride when growth falls out of favor. Do not buy it for the 0.4% yield, and do not assume the past will repeat. Compare it against VOO, VUG and QQQ, check your overlap, and do your own due diligence. You can browse more options at GrowthETFs.com or in our growth ETF scoreboard.
ETFs in this story
How this article was made: Benjie picks every topic based on what he finds useful as a dividend investor and what readers ask about. Parts of this article were drafted with help from AI tools, then edited, fact-checked and shaped by Benjie. All fund numbers come from the TopETFs database and update daily.
Disclaimer: TopETFs.com is published by Dividend Empire LLC for educational and entertainment purposes only. We are not financial advisors, and nothing on this site is financial advice, a recommendation, or a solicitation to buy or sell any security. ETF data is compiled from public sources and fund issuers, may be delayed, inaccurate or outdated, and may differ from the fund sponsor's own figures. Yields are trailing distribution yields, are not guaranteed, and distributions may include return of capital, which reduces your cost basis and is not a measure of performance. Total returns are since each fund's inception unless noted and are not comparable across funds with different start dates. Past performance does not guarantee future results. Investing carries risk, including loss of principal. Read each fund's prospectus and consult a licensed financial advisor before investing. Dividend Empire LLC receives compensation from ETF issuers for sponsored placements, which are labeled as such.