How to Check ETF Overlap (and Why VOO Plus QQQ Isn't Much Diversification)
Learn how to compare ETF holdings overlap in 10 minutes, why VOO and QQQ share so much, and what to do if your funds are mostly the same stocks.
The short version
- ETF overlap is the share of your money that ends up in the same stocks across two or more funds. Add up the smaller weight of each shared holding and you have the overlap score.
- Owning VOO and QQQ together gives you two funds but mostly one bet: big U.S. companies, led by the same mega-cap tech names.
- You can check overlap yourself with two holdings files and a spreadsheet, or with a free overlap tool. Then decide whether the duplication is on purpose.
To compare ETF holdings overlap, download the full holdings list for each fund, match the stocks they share, and add up the smaller weight of each shared stock. That total is how much of the two funds is the same. For VOO and QQQ, it is high enough that the second fund adds far less diversification than most people expect.
What ETF overlap actually means
Overlap is simple. Say one fund holds $7 of every $100 in a stock, and another fund holds $9 of every $100 in the same stock. You own that stock twice. The overlap on that one stock is the smaller number, $7 per $100. Do that for every shared stock, add it up, and you get the overlap between the two funds.
Zero percent means the funds share nothing. One hundred percent means one fund is completely contained inside the other. Real pairs land somewhere in between.
Why does this matter? Because the number of tickers in your account says nothing about how many different things you own. Five ETFs that all hold the same 30 big companies are not five diversifiers. They are one position with five labels and, often, five sets of fees.
Why VOO and QQQ overlap so much
VOO tracks the S&P 500, roughly the 500 largest U.S. companies, weighted by market value. QQQ tracks the Nasdaq-100, about 100 of the largest companies listed on the Nasdaq. Both indexes are market-cap weighted, which means the biggest companies get the biggest slices.
Here's the thing: the biggest U.S. companies by value are largely the same ones no matter which index you pick. Most of the Nasdaq-100's heavyweights are also in the S&P 500, and they sit at the top of both lists. So the stocks that drive each fund's day-to-day moves are very similar.
The funds are still different. The S&P 500 spreads across many more companies and includes sectors the Nasdaq-100 holds little of or none of, like banks, energy and many industrials. The Nasdaq-100 leans harder into technology and growth. If you want the full side-by-side, I wrote it up in VOO vs QQQ.
One more thing on scale. VOO has about $1.07T in assets and QQQ has about $476B. Both are huge, cheap to trade and widely held. Popular does not mean different.
Typical overlap between popular pairs
I won't hand you one exact number per pair, because overlap moves every time an index rebalances and every time stock prices shift the weights. Think in ranges and check the current figure yourself. This is the general picture:
| Pair | Overlap | Why |
|---|---|---|
| VOO and QQQ | High | Same mega-cap leaders at the top of both |
| QQQ and TQQQ | Near total | TQQQ targets 3x the daily move of a Nasdaq-100 style index |
| VOO and SCHD | Low to moderate | SCHD holds a screened set of dividend payers, weighted differently |
| VOO and SGOV | None | SGOV holds short Treasury bills, not stocks |
TQQQ is a special case. It is leveraged, so it isn't a copy of QQQ, but the exposure points at the same companies and then magnifies it. If you hold both, you are doubling down on one idea. I cover how that goes wrong in leveraged ETF decay.
Also notice that low overlap is not automatically good. SGOV has zero overlap with a stock fund because it is a completely different asset. That is real diversification, but it also changes your risk and return profile a lot. Overlap tells you about duplication, not whether a fund suits you.
How to check ETF overlap step by step
- Pick the funds. Use every ETF you hold, or just the two you are comparing. Start with a pair so the math stays clear.
- Get the full holdings files. Go to each fund issuer's website, find the fund page and download the holdings (usually a CSV or Excel file). Use the full list, not the "top 10" preview.
- Put both lists in one spreadsheet. Keep the ticker and the weight (share of the fund) for each. Make sure the weights are in the same format, for example all as percentages or all as decimals.
- Match the shared stocks. In a new column next to Fund A, look up each ticker's weight in Fund B. A lookup function like XLOOKUP or VLOOKUP does this. Stocks that Fund B doesn't hold return an error, so wrap the formula to return 0.
- Take the smaller weight. In the next column, use the MIN function on the two weights for each row.
- Add up the column. The sum is the overlap score between the two funds.
- Check your actual portfolio weights. If you hold $70,000 in one fund and $30,000 in another, the stock-level exposure is a blend. Multiply each fund's weights by your dollar amount to see how much you truly hold in each company.
Short on time? Many brokers and free ETF websites have a built-in overlap tool where you type two tickers and get a score and a list of shared holdings. It is a good shortcut. I still like doing it by hand once, because you learn what is actually inside your funds. You can also browse our ETF screener to compare funds side by side.
A worked example with dollar amounts
Let's use made-up numbers so you can follow the math. These are hypothetical weights, not real data. I'll show each weight as dollars per $100 held in the fund. Say Fund A is a broad S&P 500 style fund and Fund B is a Nasdaq-100 style fund. Here are their five largest shared stocks plus everything else they share:
| Stock | Fund A per $100 | Fund B per $100 | Overlap per $100 |
|---|---|---|---|
| Stock 1 | $7.00 | $9.00 | $7.00 |
| Stock 2 | $6.50 | $8.00 | $6.50 |
| Stock 3 | $6.00 | $7.50 | $6.00 |
| Stock 4 | $3.50 | $5.00 | $3.50 |
| Stock 5 | $2.00 | $4.00 | $2.00 |
| All other shared | $15.00 | $20.00 | $15.00 |
Add the last column: 7.00 + 6.50 + 6.00 + 3.50 + 2.00 + 15.00 = $40 of every $100. In this assumed example, the two funds overlap by 40 points, meaning 40 cents of each dollar is the same exposure.
Now put $100,000 into them, $50,000 each. Stock 1 is $7 per $100 in Fund A, so your $50,000 there holds $3,500 of it. Fund B holds $9 per $100, so your other $50,000 holds $4,500. Together that is $8,000 in a single company, even though you never picked it directly.
Do the same for the top five. In Fund A, the five add to $25.00 per $100, so your $50,000 holds $12,500 of them. In Fund B, they add to $33.50 per $100, so your $50,000 holds $16,750. Together, that is about $29,250 of your $100,000 in just five stocks. Holding two funds looked diversified. The top-five concentration says otherwise.
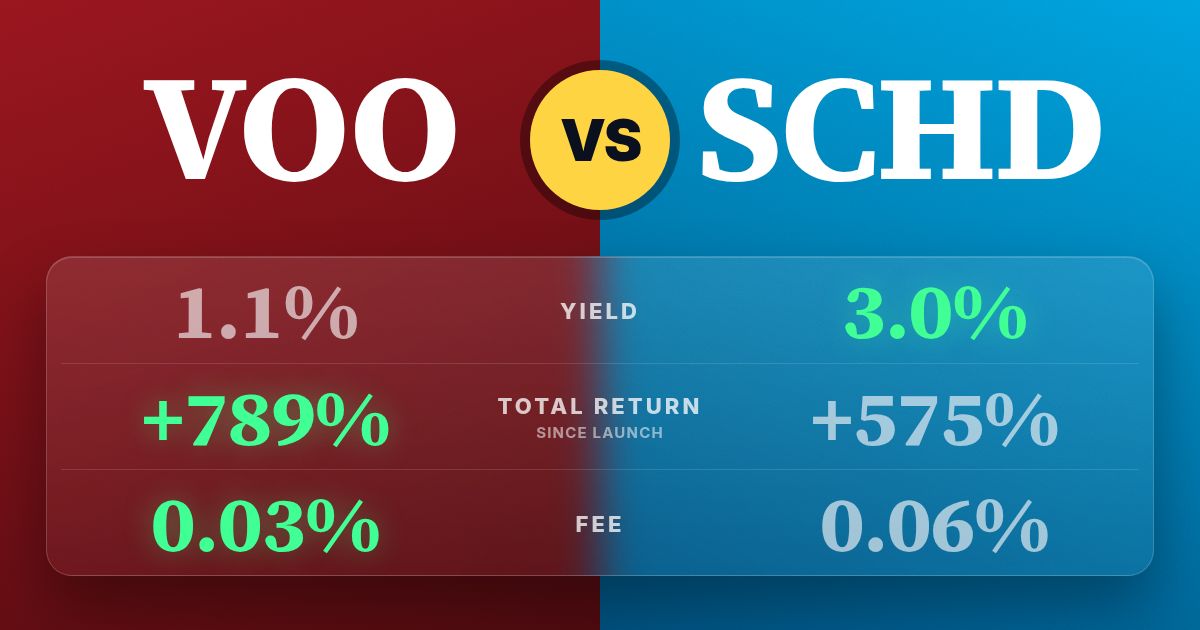
Fees add a small second cost. If both funds are cheap, you are not losing much there. For reference, VOO charges 0.03% a year. The bigger issue is not the fee, it is paying for exposure you already have.
What to do if your funds overlap heavily
First, ask whether it is on purpose. Some people hold a broad fund as a core and a growth fund as a deliberate tilt. If you know you want extra tech and growth exposure, that is a choice, not a mistake. Just know the size of the tilt.
If it is not on purpose, you have a few options:
- Drop the redundant fund. If one fund is almost entirely inside the other, you may only need one. Selling in a taxable account can trigger capital gains, so look at the tax cost first. In an IRA or 401(k), it generally doesn't.
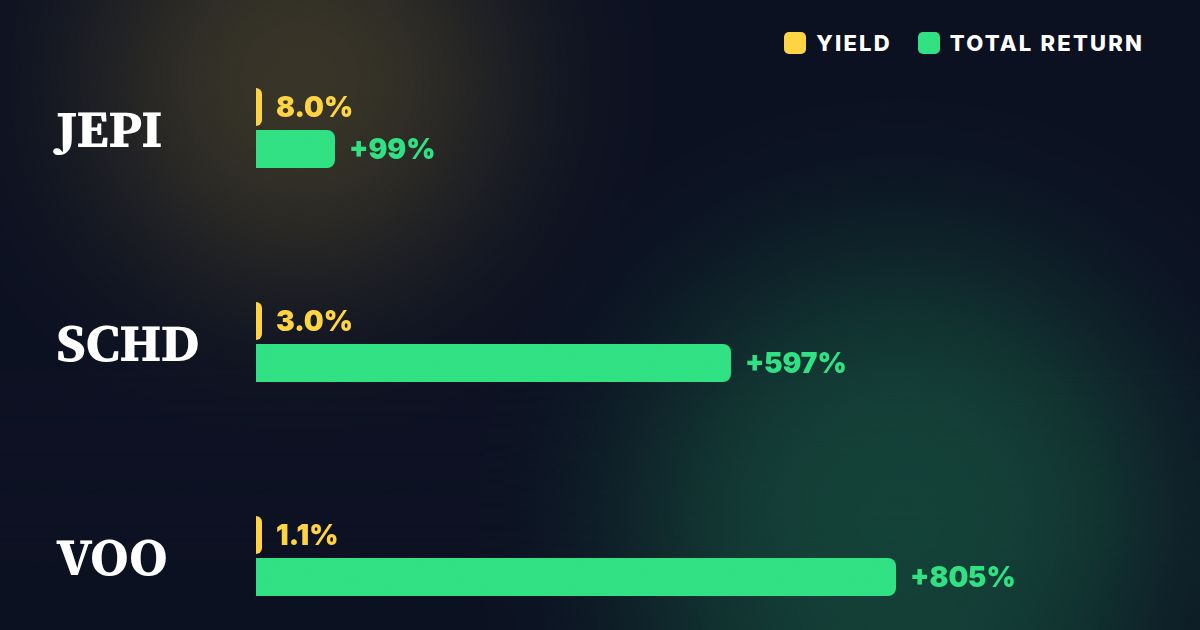
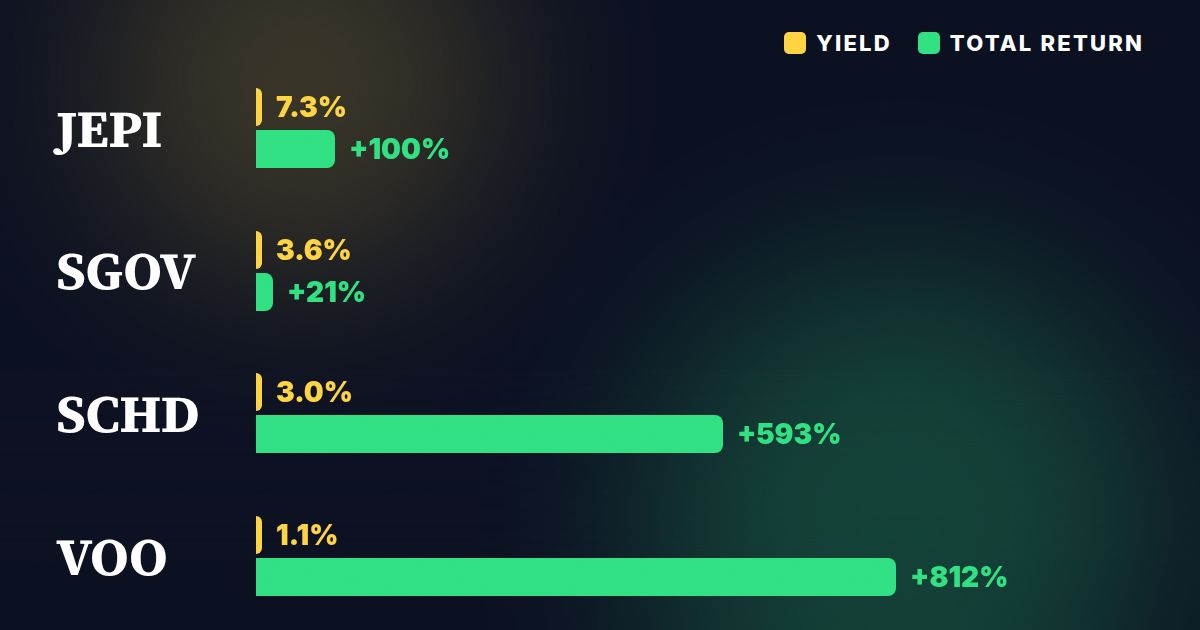
- Add something different instead. Rather than a third U.S. large-cap fund, look at what your portfolio lacks, such as international stocks, bonds or cash-like holdings. SGOV and SCHD do very different jobs from VOO, and that is the point.
- Stop adding to the overlap. You don't have to sell. You can send new contributions to the underweight areas and let the mix drift over time.
- Simplify. Fewer funds are easier to track and rebalance. See how many ETFs you should own in a Roth IRA for how I think about it.
If your goal is growth, the question is less about owning more funds and more about owning the right mix. Our QQQ review and the sister site GrowthETFs.com go deeper on growth funds.
Common mistakes when checking overlap
- Counting tickers instead of holdings. Four ETFs can still be one concentrated bet. Always look inside.
- Using only the top 10. Top 10 lists miss the long tail of shared names. Use the full file.
- Adding instead of taking the smaller weight. If one fund holds $7 per $100 and the other holds $9 per $100, the overlap is $7, not $16. Use the minimum of the two.
- Ignoring your own dollar split. Fund-level overlap is not the same as your portfolio-level exposure. Weight by what you actually hold.
- Checking once and forgetting. Weights drift as prices move. Recheck once or twice a year, and when you add a fund.
- Selling in a taxable account without checking the tax bill. Fixing overlap by selling can cost you more than the overlap does. Look at your cost basis first, and talk to a tax professional if the numbers are big.
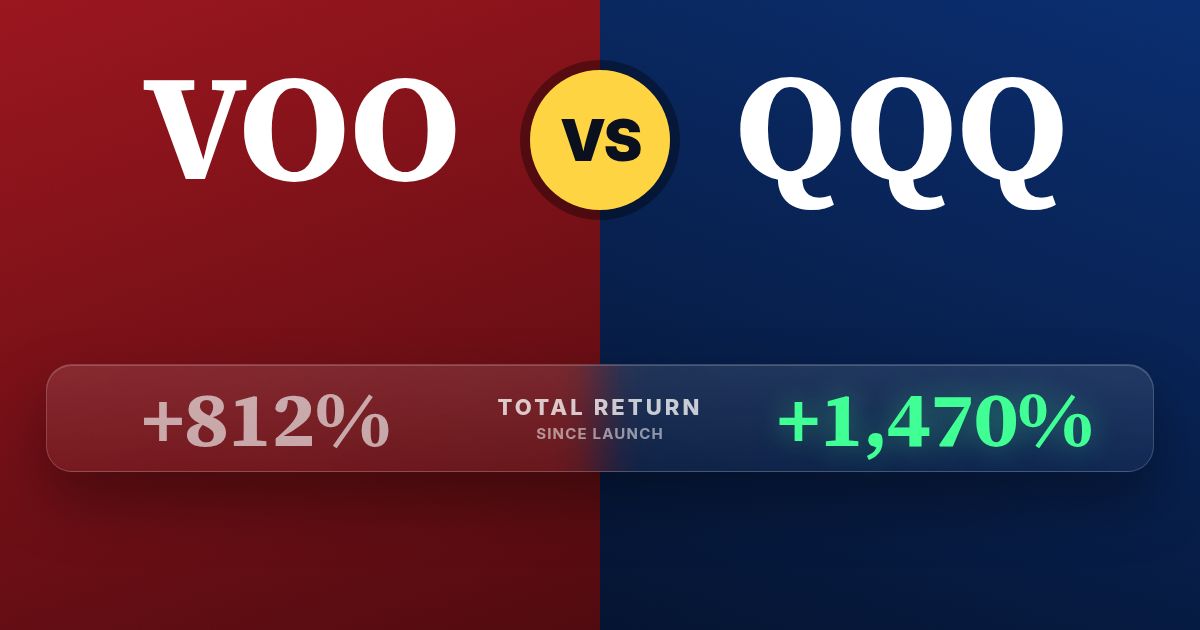
- Assuming past results prove diversification. QQQ has a total return of 1,433% since its own inception and VOO has 789% since its own, but those start on different dates, so they can't be compared directly. Strong returns do not mean the holdings are different.
A quick overlap checklist
- List every fund you own, including those inside 401(k)s and target-date funds.
- Download full holdings files, not just the top 10.
- Use the smaller weight of each shared stock, then sum.
- Weight by your real dollar amounts.
- Look at your top five blended stocks as a share of the portfolio.
- Decide whether the overlap is intentional.
- Check taxes before selling anything in a taxable account.
- Recheck once or twice a year.
FAQ
Is it bad to own both VOO and QQQ?
It isn't bad, but it isn't much diversification either. The funds share many of the same large companies, so the second one mostly adds a tilt toward technology and growth. If that tilt is what you want, it can be a fine choice.
How much ETF overlap is too much?
There is no official line. If two funds overlap heavily and you hold both without a reason, you are paying for exposure you already own. If it is a deliberate tilt, you just need to be comfortable with how concentrated the top holdings are.
Is there a free ETF overlap tool?
Yes, many brokers and ETF research websites offer one where you enter two or more tickers and see the share of common holdings. Check the result against the issuer's current holdings file if the decision matters.
Does overlap matter if my ETFs are in different accounts?
Yes. Your total exposure is what counts, not how it is split across accounts. Add up your holdings across your Roth IRA, brokerage and 401(k) before you measure.
Do bond or cash ETFs overlap with stock ETFs?
No. A short Treasury fund like SGOV holds government bills, not stocks, so its stock overlap with VOO is zero. That doesn't make it better or worse, only different.
Benjie's bottom line
Overlap is one of the easiest things to miss and one of the easiest to fix once you see it. Ten minutes with two holdings files can show you whether your fund lineup is a diversified plan or one idea in different wrappers.
I'm not saying overlap is always wrong. I'm saying you should know the number. If you want to size up a bigger move, run the numbers with our calculators and read VOO vs QQQ first. This isn't a buy or sell signal. Do your own due diligence, and check with a tax professional before selling anything in a taxable account.
ETFs in this story
How this article was made: Benjie picks every topic based on what he finds useful as a dividend investor and what readers ask about. Parts of this article were drafted with help from AI tools, then edited, fact-checked and shaped by Benjie. All fund numbers come from the TopETFs database and update daily.
Disclaimer: TopETFs.com is published by Dividend Empire LLC for educational and entertainment purposes only. We are not financial advisors, and nothing on this site is financial advice, a recommendation, or a solicitation to buy or sell any security. ETF data is compiled from public sources and fund issuers, may be delayed, inaccurate or outdated, and may differ from the fund sponsor's own figures. Yields are trailing distribution yields, are not guaranteed, and distributions may include return of capital, which reduces your cost basis and is not a measure of performance. Total returns are since each fund's inception unless noted and are not comparable across funds with different start dates. Past performance does not guarantee future results. Investing carries risk, including loss of principal. Read each fund's prospectus and consult a licensed financial advisor before investing. Dividend Empire LLC receives compensation from ETF issuers for sponsored placements, which are labeled as such.