How to Invest $100,000 for 10 Years: Lump Sum, DCA and Mixes
How to invest $100,000 for 10 years: lump sum vs dollar cost averaging, sample stock and bond mixes, T-bill ETFs, projections and tax basics.
The short version
- For money you will not touch for 10 years, the simple default is a low-cost mix of broad stock ETFs and (if you want a smoother ride) bond or T-bill ETFs, set by how much of a drop you can stomach.
- Lump sum has beaten dollar cost averaging (DCA) about two-thirds of the time in long-running studies, but DCA can be the right call if the fear of a big early drop would make you quit.
- Your stock/bond split matters far more than which exact fund you pick. Taxes and account type decide how much of the growth you actually keep.
To invest $100,000 for 10 years, pick a stock/bond split you can live with, buy it with a few low-cost, broadly diversified ETFs, and either invest it all at once or spread it over several months if that helps you stay calm. Then leave it alone, rebalance occasionally, and keep it in the most tax-friendly account you can.
That is the whole plan. The rest of this guide is the detail: the evidence on lump sum vs DCA, sample mixes with dollar figures, where cash and T-bill ETFs fit, and the tax gotchas that quietly eat returns. This is education, not a buy or sell signal, and your situation may differ.
First, ask the three questions that set your plan
Before you look at a single fund, answer these. They decide everything else.
- Is this money really untouchable for 10 years? If you might need $30,000 for a house or a business in year three, that slice does not belong in stocks.
- How would you react if $100,000 became $70,000? Stocks have had drops of 30% or more in the past. Be honest about whether you would hold or sell. Your answer sets your stock percentage.
- Do you already have an emergency fund? Three to six months of expenses in cash comes first. Do not count it as part of the $100,000.
If you want to hold for 10 years, you have time on your side, but time only helps if you do not panic out in the middle.
Lump sum vs dollar cost averaging, in plain English
Lump sum means you invest the full $100,000 now. DCA means you split it into equal chunks (say $8,333 a month for 12 months) and invest one chunk at a time while the rest waits in cash.
Here is what the research generally shows. Studies of US and other developed markets, including well-known work from Vanguard, found that lump sum investing beat DCA roughly two-thirds of the time over typical 6 to 12 month windows. The reason is simple: markets go up more often than they go down, so cash sitting on the sidelines usually misses growth.
But "two-thirds of the time" also means one-third of the time DCA wins. And the cases where it wins are the painful ones, when the market falls right after you invest.
| Scenario (assumed) | Lump sum | 12-month DCA |
|---|---|---|
| Market rises about 10% over the year | About $110,000 | About $105,000 to $106,000 |
| Market falls about 10% over the year | About $90,000 | About $95,000 |
These are rough, hypothetical illustrations. They assume a steady move and ignore interest on the cash that is waiting. Real markets zigzag, but the pattern holds: DCA lowers your regret when prices fall and gives up some gain when prices rise.
My honest take: if you can handle seeing a drop right after you invest, lump sum has the better odds. If a 15% drop in month two would make you sell everything, a 6 to 12 month DCA is a perfectly reasonable price to pay for sticking with the plan. The worst outcome is not picking the "wrong" method. It is bailing out.
Sample allocations by risk level
Here are four example mixes. These are illustrations of how people structure portfolios, not recommendations. Fund names are examples only.
- Conservative (40% stocks / 60% bonds and cash): $40,000 in a broad US stock ETF like VOO or a total market fund, $40,000 in a broad bond ETF such as BND, and $20,000 in T-bill or cash-like ETFs.
- Balanced (60/40): $45,000 US stocks, $15,000 international stocks (VXUS is a common example), $30,000 bonds, $10,000 T-bills.
- Growth (80/20): $55,000 US stocks, $25,000 international stocks, $15,000 bonds, $5,000 T-bills.
- Aggressive (100% stocks): $70,000 US stocks, $30,000 international stocks. Expect large swings.
You do not need more than two to five funds. A simple lineup beats a complicated one because you are far more likely to understand it, stick with it and rebalance it. If you want a deeper look at the biggest US index fund, see our VOO ETF review.
The role of cash and T-bill ETFs
A T-bill ETF holds very short-term US Treasury bills. SGOV (iShares 0-3 Month Treasury Bond ETF) is one example. It is not a growth engine. It is a parking spot that pays something while staying very stable, because the bills mature within months.
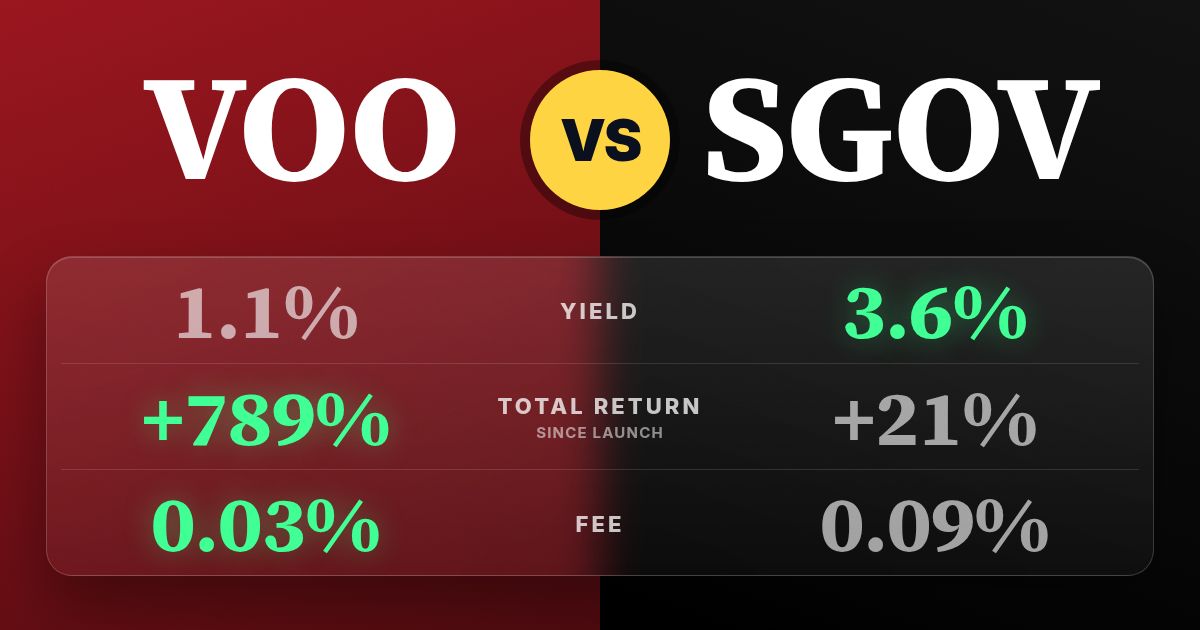
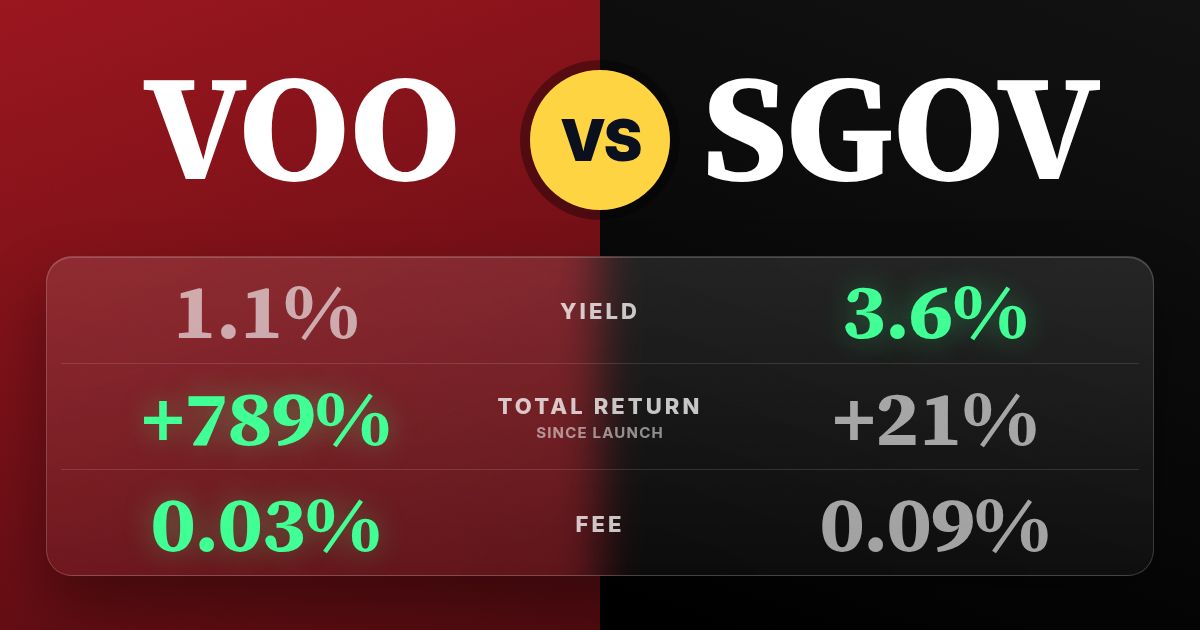
As of today, SGOV shows a yield of 3.64% with an expense ratio of 0.09%. For scale, every 1% of yield is $1,000 a year on $100,000. T-bill yields move with interest rates, so that number will change.
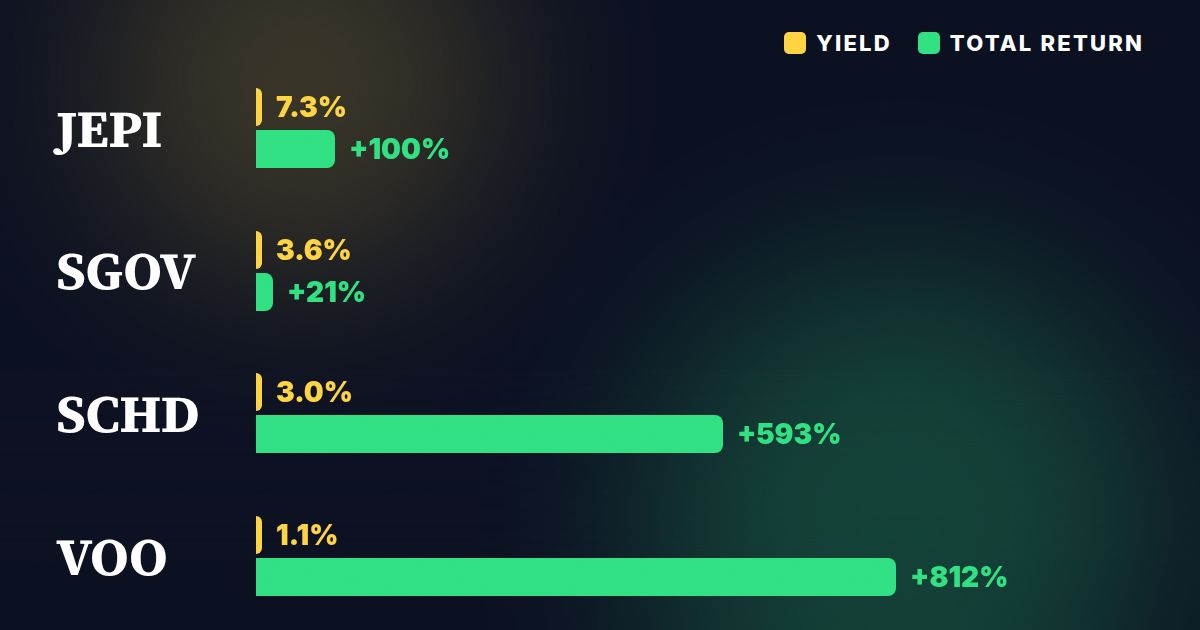
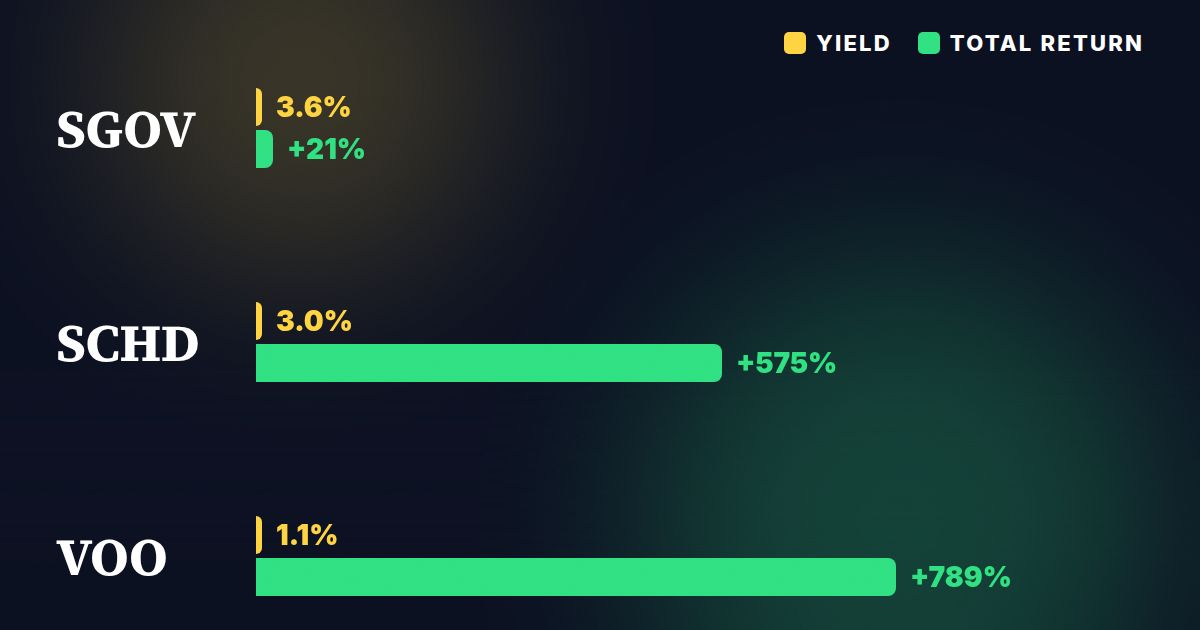
SGOV also only began trading in 2020, and its total return since inception is 21.0%. That figure covers a much shorter window than a stock fund like VOO (789% since 2010), so do not compare them directly. They do different jobs.
Cash and T-bill ETFs make sense here in three ways:
- As the safe slice of your portfolio, covering money you may need in the next few years.
- As the waiting room for a DCA plan, so the uninvested part earns something while you ease in.
- As a rebalancing source, giving you dry powder to buy stocks after a drop without selling anything else.
The trade-off is clear: over 10 years, cash has historically lagged stocks, and inflation eats away at it. Hold only what your plan needs.
Worked example: what $100,000 could become
Let me run some simple math. These are assumptions, not predictions. I will assume stocks return 7% a year and bonds and cash return 3.5% a year, with annual rebalancing and no taxes or fees. Real returns will be higher or lower, and some years will be negative.
| Mix | Stocks / safe | Assumed return | After 10 years |
|---|---|---|---|
| Conservative | 40 / 60 | 4.9% | About $161,000 |
| Balanced | 60 / 40 | 5.6% | About $171,000 |
| Growth | 80 / 20 | 6.3% | About $184,000 |
| Aggressive | 100 / 0 | 7.0% | About $197,000 |
Notice how small the gap is between the middle rows compared with the stress you may feel. Going from 60/40 to 100% stocks adds about $26,000 in this made-up example, but it also adds much bigger possible drops along the way.
Now the flip side. If stocks only returned 3% a year for the decade, a 100% stock portfolio would grow to about $134,000. At 9% it would reach about $237,000. That range, from roughly $134,000 to $237,000 for the same strategy, is why nobody can honestly promise you a number. Use our calculators to plug in your own assumptions.
Step-by-step: how to actually do it
- Set aside your emergency fund and any money you need within the next few years.
- Choose your stock/bond split using the three questions above. Write it down.
- Open or choose the right account. Use tax-advantaged space first (see the taxes section), then a regular brokerage account for the rest.
- Pick two to five low-cost ETFs that match your split. Compare expense ratios: VOO is 0.03% and SCHD is 0.06%, for example. Low fees compound in your favor over a decade.
- Decide lump sum or DCA. If DCA, set a fixed schedule (for example monthly for 6 to 12 months) and park the waiting cash in a T-bill ETF or money market fund.
- Place the orders. A limit order during market hours is a sensible default for larger trades.
- Turn on dividend reinvestment if you do not need the income. It quietly buys more shares for you.
- Rebalance on a schedule, not on headlines. See how often to rebalance for calendar vs threshold methods.
Taxes and account choice
This is where a lot of value is won or lost, and the rules change by year and by person, so confirm current numbers with your broker or a tax professional.
- Retirement accounts (401k, IRA, Roth IRA) let money grow tax-deferred or tax-free, but have annual contribution limits that change. Use them first if you are eligible. If your $100,000 is a rollover, it may already sit in one.
- Taxable brokerage accounts have no limits but are taxed. In general, gains on investments held more than a year are taxed at lower long-term capital gains rates, and many stock fund dividends are "qualified" and also taxed at lower rates.
- T-bill ETF income is generally taxed as ordinary income at the federal level, but is often exempt from state income tax. Check your tax form and local rules.
- Bond funds usually throw off income taxed as ordinary income, so they often belong in tax-advantaged accounts if you have the room. This idea is called asset location.
- Selling triggers taxes in a taxable account. Rebalancing with new cash or inside an IRA avoids that.
Broad index ETFs are tax-efficient by design because they trade rarely. That is another quiet reason a simple setup works well in a taxable account.
Common mistakes
- Chasing last year's winner. A growth-heavy fund like QQQ has had a strong run, but concentrating $100,000 in one theme is a different risk. Our VOO vs QQQ comparison lays out the trade-offs.
- Using leveraged ETFs as a "10-year hold." Funds like TQQQ reset daily and can lose money even when the market rises. Read about leveraged ETF decay first.
- Picking yield over total return. A high payout is not automatically a better result. Look at the whole picture.
- Over-diversifying into 15 funds that all hold the same stocks.
- Panic selling in a drop. This does more damage than any fee.
- Holding too much cash "until things calm down." Waiting forever is a bet too.
- Ignoring fees. Even 0.5% a year versus 0.03% adds up over a decade on $100,000.
Edge cases
- You are close to retirement. A 10-year horizon is shorter than it feels if you start withdrawing early. Lean toward more bonds and cash.
- You will add money every month. Then you are already dollar cost averaging on the new money, and the lump sum question only applies to the $100,000.
- You want income, not growth. A dividend-tilted fund like SCHD (yield 3.00%) can be one piece, but total return still matters more than the payout. For rankings, see TopDividendETFs.com.
- You want a growth tilt. Browse GrowthETFs.com and our best growth ETFs guide, and keep it to a part of the portfolio.
Checklist
- Emergency fund set aside separately
- Stock/bond split chosen and written down
- Tax-advantaged accounts used first
- Two to five low-cost, diversified ETFs selected
- Lump sum or DCA decided (with a fixed schedule if DCA)
- Dividend reinvestment set the way you want
- Rebalancing rule picked (once a year, or when a slice drifts by a set amount)
FAQ
Is it better to invest $100,000 all at once or over time?
Historically, investing all at once has come out ahead about two-thirds of the time because markets tend to rise. Spreading it out gives up some expected return in exchange for less regret if prices fall right after you invest.
What is the safest way to invest $100,000 for 10 years?
No investment is risk free. A mix weighted toward Treasury bills, bonds and a smaller slice of broad stock ETFs is generally less volatile, but it may not keep up with inflation or stock returns over a decade.
How much could $100,000 grow to in 10 years?
It depends on returns. As a hypothetical, 5% a year gives about $163,000 and 7% gives about $197,000, but real results vary and can be lower or even negative.
Should I put $100,000 in one ETF?
A single broad index ETF can work for the stock portion, but many people add bonds or cash based on their risk tolerance. A single narrow or leveraged fund is a much bigger concentration risk.
Should I hold a T-bill ETF or a high-yield savings account?
Both can hold your safe money. A T-bill ETF trades like a stock and pays monthly income, while a savings account is simpler and often insured. Compare current rates, taxes and convenience.
Do I need a financial advisor to invest $100,000?
Not necessarily, but a fee-only advisor or tax professional can help if your situation involves large rollovers, business income or complicated taxes.
Benjie's bottom line
If I had $100,000 and 10 years, I would focus on three things I can control: a stock/bond split I can hold through a bad year, low fees, and a plan for taxes. Everything else is noise.
Lump sum has better odds, DCA has better sleep. Pick the one you will actually stick with. Cash and T-bill ETFs have a job, but it is a defensive one. And no projection in this guide is a promise, so use it to build your own numbers, not to lock in an expectation.
This isn't a buy or sell signal. Do your own due diligence, and check with a tax professional about your accounts. To run your own scenarios, start with our calculators or see how income could look on Dividend Projection.
ETFs in this story
How this article was made: Benjie picks every topic based on what he finds useful as a dividend investor and what readers ask about. Parts of this article were drafted with help from AI tools, then edited, fact-checked and shaped by Benjie. All fund numbers come from the TopETFs database and update daily.
Disclaimer: TopETFs.com is published by Dividend Empire LLC for educational and entertainment purposes only. We are not financial advisors, and nothing on this site is financial advice, a recommendation, or a solicitation to buy or sell any security. ETF data is compiled from public sources and fund issuers, may be delayed, inaccurate or outdated, and may differ from the fund sponsor's own figures. Yields are trailing distribution yields, are not guaranteed, and distributions may include return of capital, which reduces your cost basis and is not a measure of performance. Total returns are since each fund's inception unless noted and are not comparable across funds with different start dates. Past performance does not guarantee future results. Investing carries risk, including loss of principal. Read each fund's prospectus and consult a licensed financial advisor before investing. Dividend Empire LLC receives compensation from ETF issuers for sponsored placements, which are labeled as such.